Main navigation
User account menu
Language

Biomes are distinct biological communities (collection of plants and animals) that have formed in response to a shared physical climate. The 11 major terrestrial biomes found in Africa (out of 14 worldwide) are partially covered by Protected Areas. This map shows the percentage of areas protected in each of the terrestrial biomes. For example: in 2020, 12,3% of montane grasslands and shrublands in Africa were covered by Protected Areas.
Biomes are distinct biological communities (collection of plants and animals) that have formed in response to a shared physical climate. They are distinguished by characteristic temperatures and amount of precipitation. This map shows the geographic distribution of the eleven major terrestrial biomes found in Africa (out of 14 worldwide). It shows that the same biome can occur in geographically distinct areas with similar climates. Annual precipitations, fluctuations in precipitation and temperature variation (on a daily and seasonal basis) are important abiotic factors influencing the geographic distribution of a biome and the vegetation type in the biome.

An intact forest landscape (IFL) is a seamless mosaic of forest and naturally treeless ecosystems with no remotely detected signs of human activity and a minimum area of 500 km2. (Potapov et al.2017) Intact forests are complex and diverse ecosystems that if lost, are irreplaceable. Research shows that designating intact forest landscapes as protected areas has proven effective at limiting their fragmentation. Since 2000, around 100 conserved and protected areas were created in intact forests areas in ACP countries, increasing the percentage of IFL protected from 11% in 2000 to 26% in 2020.
Differences in countries in terms of IFL area reduction: Cuba has not experienced any reduction in IFLs and nowadays its intact forests are fully protected by PAs (544sqkm). At the contrary Angola still not has any kind of protection for its IFLs and experienced a reduction of 39,83% of its IFL (1160 sqkm) in country.The reduction of IFL area in ACP countries was higher outside PAs (19%) than within PAs (5%).Madagascar is the country where the reduction of IFL areas was very high inside protected areas (2420 sqkm). The IFL loss inside PAs has been more than 40% between 2000 and 2020. Central African Republic experienced 23% of reduction inside PAs (938,13 sqkm). This layer shows the percentage of IFLs protected by country
| Country | IFL protected 2020 (sqkm) | IFL unprotected 2020 (sqkm) | Percentage of IFL protected 2020 | Percentage of IFL unprotected 2020 |
| Angola | 0.00 | 1752.85 | 0.00 | 100.00 |
| Belize | 3310.17 | 288.36 | 91.99 | 8.01 |
| Cameroon | 19181.16 | 12787.52 | 60.00 | 40.00 |
| Central African Republic | 3070.21 | 656.90 | 82.37 | 17.62 |
| Congo | 67218.88 | 32997.23 | 67.07 | 32.93 |
| Cote d'Ivoire | 3759.21 | 1.27 | 99.97 | 0.03 |
| Cuba | 544.02 | 0.00 | 100.00 | 0.00 |
| Democratic Republic of the Congo | 131588.22 | 465687.18 | 22.03 | 77.97 |
| Dominican Republic | 553.86 | 11.03 | 98.05 | 1.95 |
| Equatorial Guinea | 1549.39 | 555.44 | 73.61 | 26.39 |
| Ethiopia | 0 | 3233.7 | 0 | 100 |
| Gabon | 22692.90 | 53598.80 | 29.74 | 70.26 |
| Guyana | 15545.93 | 101781.93 | 13.25 | 86.75 |
| Liberia | 1573.69 | 1306.95 | 54.63 | 45.37 |
| Madagascar | 9931.34 | 867.74 | 91.96 | 8.04 |
| Nigeria | 2211.75 | 204.39 | 91.54 | 8.46 |
| Papua New Guinea | 5863.48 | 121258.17 | 4.61 | 95.39 |
| Samoa | 93.13 | 550.03 | 14.48 | 85.52 |
| Solomon Islands | 60.11 | 2569.93 | 2.29 | 97.71 |
| Suriname | 17304.85 | 75269.36 | 18.69 | 81.31 |
| Uganda | 945.21 | 16.84 | 98.25 | 1.75 |
| United Republic of Tanzania | 3627.46 | 168.85 | 95.55 | 4.45 |
| Vanuatu | 13.24 | 675.08 | 1.92 | 98.08 |
Analysis performed by Simona Lippi

This dataset is an index that estimates the relative value provided by coral reefs that protect coastlines through reduction of wave height and wave energy. The value as of 2014 is modelled as a function of exposed populations and infrastructure that received some level of protection from coastal and barrier reefs, and is described in relative terms, classified by decile (i.e., grouped into the most valuable ten percent of reefs for protection, the second-most valuable tenth of reefs, etc.). It was calculated at 1 kilometre (km) resolution globally, encompassing all countries and territories containing coral reefs.

Smallholder farmers and pastoralists have restricted access to capital and may not have the capacity to invest in management practices that mitigate land degradation. This layer displays the areas of concern for the issues related to income level derived from the convergence of global evidence of human-environment interactions that can lead to land degradation.

The Marine Ecoregions of the World is a global system to classify the oceans, helping to plan and prioritise marine conservation measures. How much are marine areas are protected at ecoregion level? For each African marine ecoregion, this map shows the percentage covered by protected areas.
Shapefile showing the location of protected areas in Africa as national parcs and natural reserves.
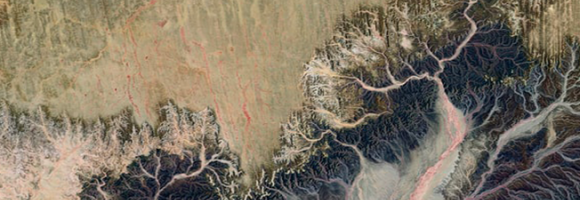
This map provides a spatially explicit characterization of 47 terrestrial habitat types, as defined in the International Union for Conservation of Nature (IUCN) habitat classification scheme, which is widely used in ecological analyses, including for quantifying species’ Area of Habitat. The map broadens our understanding of habitats globally, assist in constructing area of habitat refinements, and are relevant for broad-scale ecological studies and future IUCN Red List assessments. Periodic updates are planned as better or more recent data becomes available.
This map provides a spatially explicit characterization of 47 terrestrial habitat types, as defined in the International Union for Conservation of Nature (IUCN) habitat classification scheme, which is widely used in ecological analyses, including for quantifying species’ Area of Habitat. The map broadens our understanding of habitats globally, assist in constructing area of habitat refinements, and are relevant for broad-scale ecological studies and future IUCN Red List assessments. Periodic updates are planned as better or more recent data becomes available.
This dataset represents a geographic clip to Africa of the World Database on Protected Areas (WDPA), which is the authoritative and most complete global dataset on terrestrial and marine protected areas. The parent database is a joint initiative between the UN Environment Programme (UNEP) and the International Union for Conservation of Nature (IUCN), managed by the UNEP World Conservation Monitoring Centre (UNEP-WCMC). Information is submitted and verified by international secretariats, national and regional governments, NGOs, communities, and landowners.
This spatial dataset has been specifically filtered and clipped to include only protected areas located within the terrestrial and marine boundaries of the African continent and its associated island nations.
The dataset comprises both spatial data (GIS boundaries) and attribute data (descriptive information) for protected sites across Africa. Key attributes include site name, designation type (national, regional, or international), governance model, IUCN management category, marine/terrestrial status, and legal establishment date.
The WDPA is the primary global mechanism used to track progress toward international area-based conservation targets. This African subset is widely used across various sectors for:
The global WDPA dataset is updated and released on a monthly basis through the Protected Planet platform. This clip was extracted on May 2026.

Crop conditions monitoring is highly relevant for food security early warning and response planning in food-insecure areas of the world. GEOGLAM (the Group on Earth Observations' Global Agricultural Monitoring Initiative) aims to reinforce the international community's capacity to produce and disseminate relevant, timely, and accurate forecasts of agricultural production at national, regional, and global scales using Earth Observation data.
Copernicus4GEOGLAM, one of the Copernicus Land Monitoring Services managed by the EC Joint Research Centre, aims to produce baseline information that allows countries in Africa to improve their agricultural monitoring systems.
This dataset aggregates crop maps requested by three East African nations, showing the agricultural situation at the end of the long rain season of 2021. The results are made fully and freely accessible, covering the following areas:

This dataset provides the P50 projections for a geothermal system utilizing a Chiller unit.
Chiller refers to an absorption chiller or heat pump integrated into the geothermal system. It is used to provide cooling (by utilizing the geothermal heat) or to extract additional heat from the return fluid, thereby increasing the system's overall thermal harvest.
P50 is a statistical term used in risk analysis and forecasting. P50 represents the median scenario, meaning there is a 50% probability that the actual outcome will be higher than this value and a 50% probability it will be lower. It serves as the baseline "best estimate."
Metrics DefinitionsCoefficient of Performance (COP) [-]: A measure of efficiency, defined as the ratio of useful heating or cooling provided to the work (energy) required to operate the Chiller. Higher values indicate greater efficiency.
Doublet Net Production [MW]: The actual useful power output (Megawatts) generated by the "doublet" (one production well + one injection well), subtracting any energy used by pumps or auxiliary equipment.
Levelized Cost of Energy (LCOE) [US$ct/kWh]: The average revenue per unit of energy needed to recover the cost of building and operating the plant over its entire life cycle. It essentially represents the break-even price.
Net Present Value (NPV) [million US$]: The current financial value of all future cash flows the project will generate, minus the initial investment costs. A positive NPV generally indicates a profitable project.
Optimized Depth of the Aquifer [m]: The calculated ideal drilling depth (meters) to reach the geothermal reservoir that balances drilling costs with temperature/flow benefits.
Production Flow Rate [m³/h]: The volume of geothermal fluid extracted from the reservoir per hour (cubic meters per hour).
Temperature at Reservoir [°C]: The natural temperature (Celsius) of the geothermal fluid within the subsurface rock formation before it is brought to the surface.
Transmissivity [Dm]: A measure of how easily fluid flows through the porous aquifer. It is the product of hydraulic conductivity and aquifer thickness (often measured in Darcy-meters). High transmissivity means easier extraction.
Well Distance [m]: The physical distance (meters) between the production well (extraction) and the injection well (return). Proper spacing prevents "short-circuiting," where cool injected water lowers the temperature of the production well too quickly.
This dataset provides the P50 projections for a Direct Heat geothermal system.
Direct Heat refers to the use of geothermal energy for applications such as space heating, industrial processes, or agriculture. In the utilized model, it is assumed a minimum production temperature of at least 60°C and a reinjection temperature of 40°C.
P50 is a statistical term used in risk analysis and forecasting. P50 represents the median scenario, meaning there is a 50% probability that the actual outcome will be higher than this value and a 50% probability it will be lower. It serves as the baseline "best estimate."
Metrics DefinitionsCoefficient of Performance (COP) [-]: A measure of efficiency, defined as the ratio of useful heating or cooling provided to the work (energy) required to operate the Chiller. Higher values indicate greater efficiency.
Doublet Net Production [MW]: The actual useful power output (Megawatts) generated by the ""doublet"" (one production well + one injection well), subtracting any energy used by pumps or auxiliary equipment.
Levelized Cost of Energy (LCOE) [US$ct/kWh]: The average revenue per unit of energy needed to recover the cost of building and operating the plant over its entire life cycle. It essentially represents the break-even price.
Net Present Value (NPV) [million US$]: The current financial value of all future cash flows the project will generate, minus the initial investment costs. A positive NPV generally indicates a profitable project.
Optimized Depth of the Aquifer [m]: The calculated ideal drilling depth (meters) to reach the geothermal reservoir that balances drilling costs with temperature/flow benefits.
Production Flow Rate [m³/h]: The volume of geothermal fluid extracted from the reservoir per hour (cubic meters per hour).
Temperature at Reservoir [°C]: The natural temperature (Celsius) of the geothermal fluid within the subsurface rock formation before it is brought to the surface.
Transmissivity [Dm]: A measure of how easily fluid flows through the porous aquifer. It is the product of hydraulic conductivity and aquifer thickness (often measured in Darcy-meters). High transmissivity means easier extraction.
Well Distance [m]: The physical distance (meters) between the production well (extraction) and the injection well (return). Proper spacing prevents ""short-circuiting,"" where cool injected water lowers the temperature of the production well too quickly.
This dataset provides the P50 projections for a Direct Heat with Heat Pump geothermal system.
Direct Heat with Heat Pump refers to a scenario where a geothermal system is integrated with an industrial heat pump to upgrade low-grade heat. This allows for production from geothermal temperatures as low as 40°C, which are then heated by the pump to a delivery temperature of 80°C. The reinjection temperature is set to the production temperature minus 20°C, with a absolute minimum of 15°C.
P50 is a statistical term used in risk analysis and forecasting. P50 represents the median scenario, meaning there is a 50% probability that the actual outcome will be higher than this value and a 50% probability it will be lower. It serves as the baseline ""best estimate.""
Metrics DefinitionsCoefficient of Performance (COP) [-]: A measure of efficiency, defined as the ratio of useful heating or cooling provided to the work (energy) required to operate the Chiller. Higher values indicate greater efficiency.
Doublet Net Production [MW]: The actual useful power output (Megawatts) generated by the ""doublet"" (one production well + one injection well), subtracting any energy used by pumps or auxiliary equipment.
Levelized Cost of Energy (LCOE) [US$ct/kWh]: The average revenue per unit of energy needed to recover the cost of building and operating the plant over its entire life cycle. It essentially represents the break-even price.
Net Present Value (NPV) [million US$]: The current financial value of all future cash flows the project will generate, minus the initial investment costs. A positive NPV generally indicates a profitable project.
Optimized Depth of the Aquifer [m]: The calculated ideal drilling depth (meters) to reach the geothermal reservoir that balances drilling costs with temperature/flow benefits.
Production Flow Rate [m³/h]: The volume of geothermal fluid extracted from the reservoir per hour (cubic meters per hour).
Temperature at Reservoir [°C]: The natural temperature (Celsius) of the geothermal fluid within the subsurface rock formation before it is brought to the surface.
Transmissivity [Dm]: A measure of how easily fluid flows through the porous aquifer. It is the product of hydraulic conductivity and aquifer thickness (often measured in Darcy-meters). High transmissivity means easier extraction.
Well Distance [m]: The physical distance (meters) between the production well (extraction) and the injection well (return). Proper spacing prevents ""short-circuiting,"" where cool injected water lowers the temperature of the production well too quickly.
This dataset provides the P50 projections for an Organic Rankine Cycle (ORC) geothermal power plant.
Organic Rankine Cycle (ORC) refers to a binary power plant configuration where geothermal fluid (brine) is used to heat a secondary organic working fluid. This process allows for efficient electricity generation from medium-to-low temperature resources (typically 90°C to 150°C). The organic fluid vaporizes, drives a turbine, and is then condensed back into a liquid to repeat the cycle. The geothermal brine is reinjected into the reservoir after passing through the heat exchanger.
P50 is a statistical term used in risk analysis and forecasting. P50 represents the median scenario, meaning there is a 50% probability that the actual outcome will be higher than this value and a 50% probability it will be lower. It serves as the baseline ""best estimate.""
Metrics DefinitionsCoefficient of Performance (COP) [-]: A measure of efficiency, defined as the ratio of useful heating or cooling provided to the work (energy) required to operate the Chiller. Higher values indicate greater efficiency.
Doublet Net Production [MW]: The actual useful power output (Megawatts) generated by the ""doublet"" (one production well + one injection well), subtracting any energy used by pumps or auxiliary equipment.
Levelized Cost of Energy (LCOE) [US$ct/kWh]: The average revenue per unit of energy needed to recover the cost of building and operating the plant over its entire life cycle. It essentially represents the break-even price.
Net Present Value (NPV) [million US$]: The current financial value of all future cash flows the project will generate, minus the initial investment costs. A positive NPV generally indicates a profitable project.
Optimized Depth of the Aquifer [m]: The calculated ideal drilling depth (meters) to reach the geothermal reservoir that balances drilling costs with temperature/flow benefits.
Production Flow Rate [m³/h]: The volume of geothermal fluid extracted from the reservoir per hour (cubic meters per hour).
Temperature at Reservoir [°C]: The natural temperature (Celsius) of the geothermal fluid within the subsurface rock formation before it is brought to the surface.
Transmissivity [Dm]: A measure of how easily fluid flows through the porous aquifer. It is the product of hydraulic conductivity and aquifer thickness (often measured in Darcy-meters). High transmissivity means easier extraction.
Well Distance [m]: The physical distance (meters) between the production well (extraction) and the injection well (return). Proper spacing prevents ""short-circuiting,"" where cool injected water lowers the temperature of the production well too quickly.