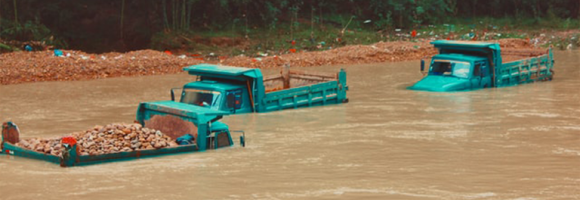
River floods are recognized as one of the major causes of economic damages and loss of human lives worldwide. Quantifying flood hazard is an essential component of resilience planning, prevention measures, emergency response, and mitigation, including insurance. This map depicts flood prone areas for flood events with a 100-year return period (i.e. with 1% chance of being exceeded in any one year). Cell values indicate water depth in meters. The map can be used to assess flood exposure and risk for population and assets.
Map showing global seismic hazard areas. This Global Seismic Hazard Map depicts Peak
Ground Acceleration (PGA) with a 10% chance of exceedance in 50
years. The data is collected as part of the Global Seismic Hazard Assessment Program (GSHAP). Here, an homogeneous approach of data collection is performed in different regions. The data was later combined in one map as an mosaic like structure. For more information please check out the source.
Values are expressed in m/s^2.
This dataset is part of the LEAP-RE project collection. For more information visit https://www.leap-re.eu/