Whether you’re monitoring crops, modelling green energy installations or soil sealing, combatting loss of natural resources or just helping countries meet their Sustainable Development Goals, chances are high that you’ll need an accurate and spatially detailed map on land cover and land use. Earth Observation satellites, like those from EU’s flagship programme Copernicus, are key to providing such maps, at a global scale, with free and open access. Land cover maps represent spatial information on different types (classes) of physical coverage of the Earth's surface, e.g. forests, grasslands, croplands, lakes, wetlands. Dynamic land cover maps include transitions of land cover classes over time and hence captures land cover changes. This dataset shows the land cover for the baseline year 2019 with a discrete classification in 23 classes aligned with UN-FAO's Land Cover Classification System.
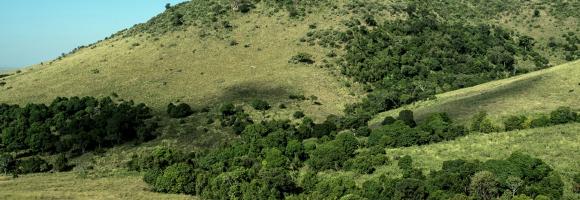
Park managers in many countries across Africa need to monitor and understand their parks features and overall health. They can rely on the highly detailed land cover information offered by the Copernicus Hot Spot Land Cover Change Explorer for specific areas of interest –or hot spots. These areas were selected for their importance in biodiversity preservation (Protected Areas, Key Landscapes for Conservation...). For each land cover class (Natural vegetation, Wetlands, urbane areas, etc.), this layer shows which portions of the areas changed to another class over the period (2000-2019). For a more detailed analysis, compare the layer with the present landcover or refer to the online Explorer. The allows to monitor land cover and land cover change in high detail and make informed decisions based on spatial data.
Copernicus is the European flagship programme for monitoring the Earth. Data is collected by Earth observation satellites and sensors on the earth’s surface. The Copernicus Land Monitoring Service provides geographical information on land use and land cover at European and global scale. Derived from the Copernicus Hot Spot Land Cover Change Explorer, this layer presents detailed land cover information for specific areas of interest –or hot spots– in Africa. These areas were selected as a priority for mapping because of their importance in biodiversity preservation (Protected Areas, Key Landscapes for Conservation...). Park managers in many countries across Africa rely on this Copernicus product to monitor and understand their parks features and overall health. Mapping habitats, assessing pressure on land, identifying prime locations for species reintroduction or new areas to protect are just a few examples of how these data can be exploited.
The Shannon index gives an understanding of crop diversity. It takes into account both the number of different crop types and their relative abundance.
Percentage of women who worked in the 12 months preceding the survey and are working currently. A lower score reflects weaker female emancipation within the labour market, and thus a higher potential impact of electricity access for improving women empowerment.
Food crisis response planning can save lives if put in place in a timely manner. To do this, decision makers must be warned of climate extreme events impacting agricultural production. The Anomaly hotSpot of Agricultural Production tool (ASAP) is an online decision support system for early warning about hotspots of agricultural production anomaly (crop and rangeland), developed by the JRC for food security crises prevention and response planning anticipation. This map shows the frequency of ASAP anomaly warnings for crop growth for 2004-2018. It highlights the high sensitivity of the main agricultural areas in Northern Africa, the Horn of Africa and the Southern African Development Community to drought conditions.
The EC JRC global map of forest cover provides a spatially explicit representation of forest presence and absence for the year 2020 at 10m spatial resolution.
The year 2020 corresponds to the cut-off date of the Regulation from the European Union "on the making available on the Union market and the export from the Union of certain commodities and products associated with deforestation and forest degradation" (EUDR, Regulation (EU) 2023/1115). In the context of the EUDR, the global forest cover map can be used as a non-mandatory, non-exclusive, and not legally binding source of information. Further information about the map and its use can be found on the EU Observatory on Deforestation and Forest Degradation (EUFO) in the section on Frequently Asked Questions.
Forest means land spanning more than 0.5 hectares with trees higher than 5 meters and a canopy cover of more than 10%, or trees able to reach those thresholds in situ, excluding land that is predominantly under agricultural or urban land use. Agricultural use means the use of land for the purpose of agriculture, including for agricultural plantations (i.e. tree stands in agricultural production systems such as fruit tree plantations, oil palm plantations, olive orchards and agroforestry systems) and set- aside agricultural areas, and for rearing livestock. All plantations of relevant commodities other than wood, that is cattle, cocoa, coffee, oil palm, rubber, soya, are excluded from the forest definition.
The global map of forest cover was created by combining available global datasets (wall-to-wall or global in their scope) on tree cover, tree height, land cover and land use into a single harmonized globally-consistent representation of where forests existed in 2020.
The workflow consisted in first mapping the global maximum extent of tree cover circa the year 2020 from the combination of ESA World Cover 2020 and 2021, WRI Tropical Tree Cover 2020, UMD Global land cover and land use 2019, Global Mangrove Watch 2020, and JRC Tropical Moist Forest 2020 datasets. In the second step, a series of overlays and decision rules were applied to reduce this maximum extent of tree cover and align it with the Forest definition using datasets covering cropland and commodity expansion (ESA World Cereal, UMD Global land cover and land use 2019, UMD Global Cropland Expansion, High-resolution global map of smallholder and industrial oil palm plantations, and WRI Spatial Database of Planted Trees), land use change (UMD global forest cover loss, JRC Tropical Moist Forest, IIASA Global Forest Management), built-up (JRC Global Human Settlement), and water (JRC Global Surface Water).
The detailed mapping approach will be described in a separate technical report expected to be released by March 2024. The accuracy of this map has not been yet assessed but will be reported as soon as available.
Land cover is defined as the physical material at the surface of the earth, usually documented via the interpretation of earth observations. Common land cover types include trees, grass, bare ground, built up areas, water, etc. How well are different ecosystem types (as indicated by land cover) preserved and how strong are anthropogenic changes affecting their distribution in a given area? Human pressures are constantly increasing and it is important to monitor the consequences of the associated changes on the environment. This map shows the changes in land cover between 1995 and 2015.
Percentage of women who are literate. This indicator highlights the importance of electricity for women, who spend the majority of their time taking care of the households. Electricity can ease girls and young women from houdeholds duties and allow them to attend schools. Thus, the lower the number of households with access to electricity the greater the potential for decentralised renewable energies to improve literacy levels among women.
From the new available dataset in GFW on tree cover change between 2000 and 2020, here we are displaying the net change in tree cover by percent for country.The net change in tree cover corresponds to the area of gross gain minus the area of gross loss to show the overall change (negative or positive). The attribute table provides also statistics on net change in tree cover such stable forest or disturbed forest(in hectars).
This dataset is accessed through Global Forest Watch on 04/10/2022. www.globalforestwatch.org.
Potapov, P., Hansen, M.C., Pickens, A., Hernandez-Serna, A., Tyukavina, A., Turubanova, S., Zalles, V., Li, X., Khan, A., Stolle, F., Harris, N., Song, X-P., Baggett, A., Kommareddy, I., and Kommareddy, A. 2022. The Global 2000-2020 Land Cover and Land Use Change Dataset Derived From the Landsat Archive: First Results. Frontiers in Remote Sensing, 13, April 2022. https://doi.org/10.3389/frsen.2022.856903; summarized by administrative area at WRI
This layer shows the percentage of children under 6 months who are exclusively breastfed, meaning they receive only breast milk without any additional food or drink. Exclusive breastfeeding is a key determinant of child survival, growth, and development.
Percentage of children in a school attendance age (approximately 3-17 years old depending on the country) that have internet connection at home. Also in this case the indicator relates to the potential educational impact of electrification on children and young people.
Forests worldwide are in a state of flux, with accelerating losses in some regions and gains in others. Given the recognized importance of forest ecosystem services, quantification of global forest extent and change is needed. This map displays the tree cover in the year 2000. Tree cover is defined as canopy closure for all vegetation taller than 5m in height and is expressed as a percentage per output grid cell, in the range 0–100.
Percentage of undernourished people. The higher the incidence of undernourished people the more beneficial decentralised renewable energy solutions may be, in terms of improving both cooking facilities within households and agricultural productivity with positive impacts on nutrition. Thus electricity can be used to make agricultural practices more efficient and refrigerate food produce to store for longer.
Prevalence of underweight (weight-for-age <-2 standard deviation from the median of the World Health Organization (WHO) Child Growth Standards) among children under 5 years of age. Survey estimates are based on standardized methodology using the WHO Child Growth Standards. Global and regional estimates are based on methodology outlined in UNICEF-WHO-The World Bank: Joint child malnutrition estimates - Levels and trends (UNICEF/WHO/WB 2012).
Access to piped water reflects the availability of improved water sources directly delivered to households. This layer shows the percentage of people with access to piped water in 2017. Low coverage may signal the need for targeted interventions, potentially supported by decentralized energy systems to power water pumping and distribution.
Crop conditions monitoring is highly relevant for food security early warning and response planning in food-insecure areas of the world. GEOGLAM (the Group on Earth Observations' Global Agricultural Monitoring Initiative) aims to reinforce the international community's capacity to produce and disseminate relevant, timely, and accurate forecasts of agricultural production at national, regional, and global scales using Earth Observation data.
Copernicus4GEOGLAM, one of the Copernicus Land Monitoring Services managed by the EC Joint Research Centre, aims to produce baseline information that allows countries in Africa to improve their agricultural monitoring systems.
This dataset aggregates crop maps requested by three East African nations, showing the agricultural situation at the end of the long rain season of 2021. The results are made fully and freely accessible, covering the following areas:
Water Footprint in Africa, considered as the sum of both the green and blue WF and defined as the ratio between evapotranspiration (in m3 per hectare) and crop yield (in ton per hectare). The values are expressed in m3/ton.
Forests worldwide are in a state of flux, with accelerating losses in some regions and gains in others. Given the recognized importance of forest ecosystem services, quantification of global forest extent and change is needed. This map displays the forest gain during the period 2000–2018. Forest gain is defined as the inverse of loss, or a change from non-forest to forest entirely within the study period. It is expressed as either 1 (gain) or 0 (no gain).
Forests worldwide are in a state of flux, with accelerating losses in some regions and gains in others. Given the recognized importance of forest ecosystem services, quantification of global forest extent and change is needed. This map displays the forest loss during the period 2000–2018, defined as a stand-replacement disturbance, or a change from forest to non-forest state. It is expressed as either 1 (loss - in red) or 0 (no loss).