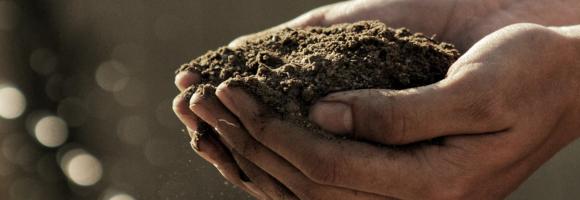
This dataset provides projections of global rainfall erosivity changes, a critical metric representing the erosive force of rainfall that drives worldwide soil and nutrient loss. These maps serve as essential inputs for global and regional soil erosion assessment models. The collection details the geographical distribution of projected erosivity changes across two primary periods: 2010–2050 and 2050–2070. To account for different climate trajectories, the dataset includes models for three distinct Representative Concentration Pathway (RCP) scenarios for both timeframes: RCP 2.6 (stringent mitigation), RCP 4.5 (intermediate emissions), and RCP 8.5 (high emissions). By combining these temporal and climatic variables, users can evaluate and compare potential future soil erosion risks under varying degrees of global climate change.
Some extraordinary changes have occurred across the globe over the past decades regarding human habitation. Globally, between 1975 and 2015 built-up areas increased by approximately 250 %, while population increased by a factor of 1.8. The most considerable changes occurred in Africa where it has nearly quadrupled. The extent of built-up area poses a number of challenges to global sustainable development. As urban clusters expand, productive land and soil is sealed, and natural ecosystems are replaced by land use to support urban centres. This layer highlights the areas of concern for built-up related issues derived from the convergence of global evidence of human-environment interactions that can have land degradation consequences.
The data provided here are the result of a time-series analysis of carbon density change (in Mg/ha) between 2003-2014 spanning tropical America, Africa, and Asia (23.45 N lat.-23.45 S lat.). The original data is provided as two separate rasters representing (1) carbon density net gain and (2) carbon density net loss within each ~463 x 463 metre pixel, with only pixels exhibiting statistical significance at the 95% level being reported. The data here was re-projected from the its original MODIS sinusoidal projection to WGS84.
During the last twenty years (2000-2020) the intact forest landscapes extent within African, Caribbean and Pacific countries, decreased by 16% (237275km2).
However the protection of IFLs increased in the last two decades. Since 2000, around 100 conserved and protected areas were created in intact forests areas in ACP countries, increasing the percentage of IFL protected from 11% in 2000 to 26% in 2020.. Ethiopia has proposed six protected areas that will cover the total extent of IFL in the country. Republic of Congo increased IFL protection from 15,78% in 2000 to 67,07% in 2020.
Country
Percentage protected in 2000
Percentage protected in 2013
Percentage protected in 2016
Percentage protected in 2020
Angola
0.00
0.00
0
0.00
Belize
90.63
92.14
91.44447
91.99
Cote d'Ivoire
45.76
68.62
70.72509
82.37
Cameroon
98.89
99.96
99.96414
99.97
Central African Republic
14.20
39.23
47.47338
60.00
Congo
12.65
19.72
21.21028
22.03
Cuba
15.78
59.62
63.48035
67.07
Democratic Republic of the Congo
0.00
100.00
100
100.00
Dominican Republic
0.00
98.05
98.04902
98.05
Equatorial Guinea
1.07
0.00
0
0.00
Ethiopia
5.23
27.32
28.38109
29.74
Gabon
36.57
66.72
72.62826
73.61
Guyana
2.89
12.50
12.99736
13.25
Liberia
29.30
43.19
43.42341
54.63
Madagascar
34.84
39.28
37.74979
91.96
Nigeria
88.66
89.20
89.64465
91.54
Papua New Guinea
2.36
3.50
3.627328
4.61
Samoa
0.00
0.00
0
2.29
Solomon Islands
11.64
16.82
17.09852
18.69
Suriname
83.56
86.31
85.87311
95.55
Uganda
96.84
97.64
97.85507
98.25
United Republic of Tanzania
2.02
1.91
1.906882
1.92
Vanuatu
0.00
14.54
14.54262
14.48
Analysis performed by Simona Lippi
Reference:
Potapov, P., Hansen, M. C., Laestadius L., Turubanova S., Yaroshenko A., Thies C., Smith W., Zhuravleva I., Komarova A., Minnemeyer S., Esipova E. “The last frontiers of wilderness: Tracking loss of intact forest landscapes from 2000 to 2013” Science Advances, 2017; 3:e1600821
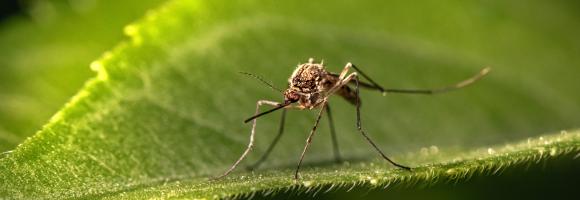
Malaria, a life-threatening disease transmitted by mosquitoes, affects millions of people worldwide. Treatment and prevention efforts such as insecticide-treated mosquito nets and rapid diagnostic tests significantly decreased the number of malaria cases in Africa. This layer displays the change in malaria rates (%) from 2000 to 2015 among children in Sub-Saharan Africa.
''Intact Forest Landscapes (IFLs) are defined as those with an unfragmented area of at least 500 km2 and which are minimally influenced by human economic activity''.(Thies et al. 2011) IFLs are critical for stabilizing terrestrial carbon storage, harboring biodiversity, regulating hydrological regimes, and providing other ecosystem functions. Researchers, firstly, created a global IFL map using existing fine-scale maps and a global coverage of high spatial resolution satellite imagery (Potapov et al. 2008). Moreover they assessed the distribution and dynamics of IFLs within the extent of present-day forest ecosystems tracking loss of intact forest landscapes from 2000 to 2020. In this layer we show the reduction of the IFL extent for African, Caribbean and Pacific (ACP)countries that decreased by 16,6% since the year 2000. Countries that experienced the largest reduction in intact forest landscape area over the past two decades are Solomon Islands with 66,3 %, Central African Republic with 57% and Equatorial Guinea with 50,4%. Democratic Republic of the Congo still has the highest proportion of intactness of ACP countries with 59,7Mha. IFL in Democratic Republic of the Congo has an extent of 64,3Mha as the 27,7% of its forest cover.
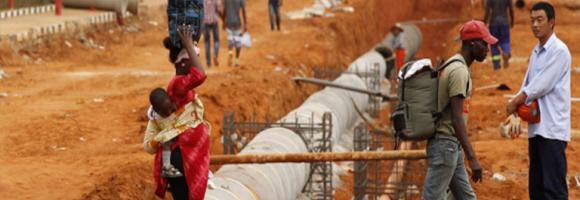
How do development projects influence the geographic distribution of economic activity within low-income and middle-income countries? Existing research focuses on the effects of Western development projects on inter-personal inequality and inequality across different subnational regions. However, China has become a major financier of economic infrastructure in Africa. This dataset geo-locates Chinese Government-financed projects between 2000 and 2014. It captures 3,485 projects worth $273.6 billion in total official financing. It includes both Chinese aid and non-concessional official financing. Chinese development projects in general, and Chinese transportation projects in particular, appear to reduce economic inequality within and between subnational localities.
At any given place on Earth, complex human-environment interactions are at play. They include differing rates and magnitudes of drivers (e.g. overgrazing, climate change, agricultural practices) and differing consequences in land degradation (e.g. soil erosion, changes in productivity, loss of biodiversity). The occurrence of multiple global change issues at a location suggests a potential for land degradation, at least in some form. This layer depicts where global change issues relevant to land degradation coincide at a global scale. It helps identifying local or regional areas of concern where land degradation processes may be underway.
Park managers in many countries across Africa need to monitor and understand their parks features and overall health. They can rely on the highly detailed land cover information offered by the Copernicus Hot Spot Land Cover Change Explorer for specific areas of interest –or hot spots. These areas were selected for their importance in biodiversity preservation (Protected Areas, Key Landscapes for Conservation...). For each land cover class (Natural vegetation, Wetlands, urbane areas, etc.), this layer shows which portions of the areas changed to another class over the period (2000-2019). For a more detailed analysis, compare the layer with the present landcover or refer to the online Explorer. The allows to monitor land cover and land cover change in high detail and make informed decisions based on spatial data.
Land cover is defined as the physical material at the surface of the earth, usually documented via the interpretation of earth observations. Common land cover types include trees, grass, bare ground, built up areas, water, etc. How well are different ecosystem types (as indicated by land cover) preserved and how strong are anthropogenic changes affecting their distribution in a given area? Human pressures are constantly increasing and it is important to monitor the consequences of the associated changes on the environment. This map shows the changes in land cover between 1995 and 2015.
From the new available dataset in GFW on tree cover change between 2000 and 2020, here we are displaying the net change in tree cover by percent for country.The net change in tree cover corresponds to the area of gross gain minus the area of gross loss to show the overall change (negative or positive). The attribute table provides also statistics on net change in tree cover such stable forest or disturbed forest(in hectars).
This dataset is accessed through Global Forest Watch on 04/10/2022. www.globalforestwatch.org.
Potapov, P., Hansen, M.C., Pickens, A., Hernandez-Serna, A., Tyukavina, A., Turubanova, S., Zalles, V., Li, X., Khan, A., Stolle, F., Harris, N., Song, X-P., Baggett, A., Kommareddy, I., and Kommareddy, A. 2022. The Global 2000-2020 Land Cover and Land Use Change Dataset Derived From the Landsat Archive: First Results. Frontiers in Remote Sensing, 13, April 2022. https://doi.org/10.3389/frsen.2022.856903; summarized by administrative area at WRI
The human imprint on the planet has a major impact on the functioning of the Earth system. Because the impact on the environment is closely intertwined with population dynamics, it is important to monitor and include these in the evaluation of land degradation. This layer displays the areas of concern for population change related issues derived from the convergence of global evidence of human-environment interactions that can lead to land degradation. It reflects the dynamics of increasing number of people in a certain area.
"This map shows, for each grid cell, the environmental impact in terms of CO₂-equivalent emissions per kilowatt-hour [g CO2 eq/kWh] generated by by the following systems:
Cooling Absorption System;
Refrigeration Absorption System;
Binary ORC Power Plant;
Flash Power Plant;
Heat for Direct Use;
Heat for High Temperature Heat Pump;
The maps refer to:
base case scenario;
upside scenario, modelling a better fluid flow;
up up side, modelling both better fluid flow and higher underground temperatures.