Chlorophyll-a concentrations (Chla) are an indicator of phytoplankton abundance and biomass in open waters. They can be an effective measure of trophic status and are commonly used to measure water quality. This layer compares the Chla value from the last full month with the long-term mean Chla. A positive anomaly (warm colours) means the monthly Chla is higher than the long-term average for that month; a negative anomaly (cool colours) means it is lower than the average.
Monitoring of sea surface temperature (SST) provides fundamental information on the global climate system and for the study of marine ecosystems. This layer compares the SST value of the last full month with the long-term mean SST. A positive anomaly (warm colours) means the monthly SST is warmer than the long-term average for that month; a negative anomaly (cool colours) means it is cooler than the average.
Normalized Difference Vegetation Index (NDVI), Leaf Array Index (LAI), and Fraction of Absorbed photosynthetic Radiation (FAPAR) timeseries information from eStation services.
Increasing water scarcity and water quality issues are serious constraints in Africa and worldwide. Measuring precipitation anomalies is important for detecting and characterizing meteorological droughts, and, in the agricultural sector especially, for effectively managing climate related uncertainties. This layer shows the deviation of the precipitations of the last full month from the long-term average of the same month. A positive anomaly (shades of blue) means there was more rainfall than average during that month. A negative anomaly (yellow to red) means there was less rainfall than average during that month.
Vegetation fires have become a major concern in Africa because of their negative impacts on the environment and on human welfare. Uncontrolled (and un-prescribed) wildfires cause forest and vegetation degradation and related biodiversity loss, resulting in immediate and long-term impacts on the livelihoods of local communities and upstream impacts on national and regional economies. Fires in the tropical environment are a major contributor to tropical forest degradation and, if too frequent, can lead to savannisation of these areas. Vegetation fires are also a significant source of trace gases and aerosols in the atmosphere and contribute to the anticipated climate change, particularly with emissions of CO2. This layer shows the deviation of dekadal fire occurrences from the long-term average of the same 10-day period. A positive anomaly means more fire events than average for the last full 10-day period (red). A negative anomaly means less fire events than average for the last full 10-day period (green).
The Copernicus Global Land Service - Burnt Area products depict burn scars, surfaces which have been sufficiently affected by fire to display significant changes in the vegetation cover (destruction of dry material, reduction or loss of green material) and in the ground surface (temporarily darker because of ash). The monthly products are available at global scale in the spatial resolution of 300 m and cover the period from January 2019 to April 2022. The pixel bears the value of the day of the year in which the burn scars were visible while, if selected for mapping in this platform, the dataset shows the burn scars detected in the selected month.
Percentage of children 24-35 months who had received all age appropriate vaccinations. The lower the number of vaccinated children, the more beneficial decentralised renewable energy solutions may be in providing electricity to store vaccines in proper refrigerators.
Côte d'Ivoire and Ghana are the main largest producers of cocoa in the world. However, the cultivation of this crop has led to the loss of vast tracts of forest areas in both countries. Efficient and accurate methods for remotely identifying cocoa farms are essential for the implementation of sustainable cocoa practices and the periodic and effective monitoring of forests. This map, generated using Random Forest image classification, shows the 2019 distribution of cocoa farms in both countries. The estimated area for cocoa is 4.8Mha for Cote d'Ivoire and 2.3Mha for Ghana.
An intact forest landscape (IFL) is a seamless mosaic of forest and naturally treeless ecosystems with no remotely detected signs of human activity and a minimum area of 500 km2. (Potapov et al.2017) Intact forests are complex and diverse ecosystems that if lost, are irreplaceable. Research shows that designating intact forest landscapes as protected areas has proven effective at limiting their fragmentation. Since 2000, around 100 conserved and protected areas were created in intact forests areas in ACP countries, increasing the percentage of IFL protected from 11% in 2000 to 26% in 2020.
Differences in countries in terms of IFL area reduction: Cuba has not experienced any reduction in IFLs and nowadays its intact forests are fully protected by PAs (544sqkm). At the contrary Angola still not has any kind of protection for its IFLs and experienced a reduction of 39,83% of its IFL (1160 sqkm) in country.The reduction of IFL area in ACP countries was higher outside PAs (19%) than within PAs (5%).Madagascar is the country where the reduction of IFL areas was very high inside protected areas (2420 sqkm). The IFL loss inside PAs has been more than 40% between 2000 and 2020. Central African Republic experienced 23% of reduction inside PAs (938,13 sqkm). This layer shows the percentage of IFLs protected by country
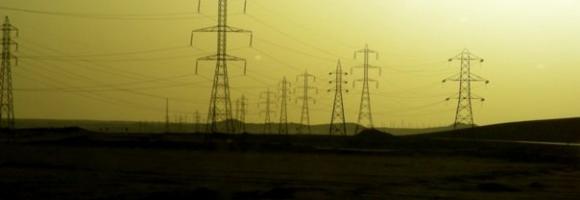
In Sub-Saharan Africa, medium- and low-voltage data are often non-existent, uncompleted, or unavailable. This is a challenge for practitioners working on the electricity access agenda, power sector resilience or climate change adaptation. This layer presents the spatial extent of the existing and planned electricity grid (high, medium, low voltage level) compiled using multiple sources that enumerate elements of the existing transmission and distribution network.
Reference evapotranspiration (Global - Monthly - ~10 km) August 2025- AQUASTAT (FAO) AgERA5 derived.
Reference evapotranspiration per month with a spatial resolution of 0.1 degree. Unit: mm month-1. The dataset contains monthly values for global land areas, excluding Antarctica, since 1979. The dataset has been prepared according to the FAO Penman - Monteith method as described in FAO Irrigation and Drainage Paper 56.
https://data.apps.fao.org/catalog/dataset/c91430cc-681e-4ca8-a5f4-8c97dc92c547/resource/ff49908e-2e07-48b3-8deb-0c69af411859
In 2020, a group of researchers carried out analysis to examine the importance of Indigenous Peoples’ lands for preserving Intact Forest Landscapes.(Fa et al.2020)They used geospatial data on the extent of Indigenous Peoples’ lands reported by Garnett et al. (2018), and Geospatial data for IFLs were sourced from the Intact Forest Landscapes website (www.intactforests.org) for the years 2000, 2013, and 2016 (Potapov et al. 2017)In the paper they have shown that the proportion of Indigenous Peoples’ lands mapped as IFLs was considerably higher (10.9%) than the proportion of other lands (defined here as all land outside Indigenous Peoples’ lands) mapped as IFLs (6.8%).
In this map we reported the percentage of Intact Forest Lansdcapes reduction in Indigenous People Lands for the period 2000-2016. IN the table we reported also the percentage of IFLs reduction in other lands. To explore more IFLs conservation strategies for African, Caribbean and Pacific countries you can check BIOPAMA Geonode Layers
Sources:
Fa JE, Watson JE, Leiper I, Potapov P, Evans TD, Burgess ND, Molnár Z, Fernández‐Llamazares Á, Duncan T, Wang S, Austin BJ. Importance of Indigenous Peoples’ lands for the conservation of Intact Forest Landscapes. Frontiers in Ecology and the Environment. 2020 Apr;18(3):135-4
Adult literacy rate is the percentage of people ages 15 and above who can both read and write with understanding a short simple statement about their everyday life. Literacy statistics for most countries cover the population ages 15 and older, but some include younger ages or are confined to age ranges that tend to inflate literacy rates. The youth literacy rate for ages 15-24 reflects recent progress in education. It measures the accumulated outcomes of primary education over the previous 10 years or so by indicating the proportion of the population who have passed through the primary education system and acquired basic literacy and numeracy skills.
From the new available dataset in GFW on tree cover change between 2000 and 2020, here we are displaying the net change in tree cover by percent for country.The net change in tree cover corresponds to the area of gross gain minus the area of gross loss to show the overall change (negative or positive). The attribute table provides also statistics on net change in tree cover such stable forest or disturbed forest(in hectars).
This dataset is accessed through Global Forest Watch on 04/10/2022. www.globalforestwatch.org.
Potapov, P., Hansen, M.C., Pickens, A., Hernandez-Serna, A., Tyukavina, A., Turubanova, S., Zalles, V., Li, X., Khan, A., Stolle, F., Harris, N., Song, X-P., Baggett, A., Kommareddy, I., and Kommareddy, A. 2022. The Global 2000-2020 Land Cover and Land Use Change Dataset Derived From the Landsat Archive: First Results. Frontiers in Remote Sensing, 13, April 2022. https://doi.org/10.3389/frsen.2022.856903; summarized by administrative area at WRI
Net official development assistance (ODA) is government aid designed to promote the economic development and welfare of developing countries. Aid may be provided bilaterally, from donor to recipient, or channelled through a multilateral development agency such as the United Nations or the World Bank. Net official aid (OA) refers to aid flows from official donors to more advanced (developing) countries and territories. Official aid is provided under terms and conditions similar to those for ODA. This map shows the aggregated figure (sum of ODA and OA) for African countries. Data are in current U.S. dollars.
This layer shows the percentage of children under 6 months who are exclusively breastfed, meaning they receive only breast milk without any additional food or drink. Exclusive breastfeeding is a key determinant of child survival, growth, and development.
Ocean temperature is related to ocean heat content (the energy absorbed by the ocean), an important topic in the study of global warming. Monitoring of sea surface temperature (SST) from earth-orbiting infrared radiometers has had a wide impact on oceanographic science. It provides fundamental information on the global climate system and for the study of marine ecosystems. For example, it helps estimating heat stress conducive to coral bleaching, the process by which they expel the symbiotic algae living in their tissues and become white (bleached) and vulnerable. The NOAA Coral Reef Watch Daily Global 5km Satellite Sea Surface Temperature product (a.k.a. CoralTemp) measures the night-time ocean temperature at the sea surface, calibrated to 0.2 meters depth.
This dataset compiles geophysical models detailing the thickness of the Earth's outer layers, ranging from surface sedimentary basins down to the base of the lithosphere. The collection serves a dual purpose: it provides broad, global baseline data for sediment distribution, while also offering high-resolution, integrated regional models specifically focused on the African plate.
Dataset Contents:
I. Global Baselines
Global Sediment Thickness (Laske & Masters, 2013): The global sediment thickness baseline extracted from the CRUST1.0 model. This provides broad, foundational coverage across both continental and oceanic domains. (Values expressed in km).
Global Oceanic Sediment Thickness (Straume et al., 2019): A high-resolution, 5-arc-minute grid detailing total sediment thickness specifically for the world's oceans and marginal seas, compiled from extensive new data and previous work. (Values expressed in m).
II. African Regional Models
Combined Sediment Thickness (Africa): A synthesized, optimized sedimentary thickness map for Africa and its surrounding regions. This layer intelligently merges the Laske & Masters (2013) and Straume et al. (2019) maps, prioritizing the Straume data wherever overlaps occur to maximize resolution. (Values expressed in m).
Crustal Thickness (Globig et al., 2016): An Africa-specific crustal thickness map derived from the integrated modeling of elevation, geoid data, and rigorous thermal analysis. (Values expressed in km).
Lithosphere Thickness (Globig et al., 2016): An Africa-specific lithospheric thickness map, complementing the crustal layer, derived using the same integrated elevation, geoid, and thermal modeling approach. (Values expressed in km).
The current version of the GDW database (version 1.0) aims to catalogue all types of anthropogenic instream barriers. While initial mapping efforts prioritize major dams that form reservoirs, as well as run-of-river barriers on larger rivers where more information is readily available, the dataset comprises two distinct but interconnected spatial layers:
Barrier and Dam Locations (Point Layer): Contains barrier and dam locations, geospatially referenced as point coordinates and co-registered to the global river network of HydroSHEDS.
Reservoir Extents (Polygon Layer): Contains associated reservoir polygons, which includes data representing the maximum storage capacity of the reservoirs measured in million cubic meters.
<p>NaturAfrica's efforts are concentrated on ‘mega-landscapes’—biogeographical regions identified as crucial for both conservation and development. These regions encompass:</p>
<ul>
<li>The forest ecosystems of the Congo Basin;</li>
<li>Landscapes of transhumance pastoralists in North Cameroon, the Central African Republic, and Chad;</li>
<li>Guinean forests of West Africa;</li>
<li>Savannahs in the Sudano-Sahelian zone of West Africa;</li>
<li>Savannahs and watersheds of the East Africa rift;</li>
<li>Transfrontier conservation areas of Southern Africa.</li>
</ul>
<p>The layer was developed to support the prioritization of intervention areas for the second phase of this initiative, which combines conservation with sustainable job creation. It provides a spatially explicit characterization of ecological value across these landscapes, evaluated and attributed based on five core ecological and environmental dimensions:</p>
<ul>
<li><span class="label">Threatened Species Richness:</span> Concentration and diversity of threatened species.</li>
<li><span class="label">Species Endemicity:</span> Presence of endemic species unique to the specific geographic region.</li>
<li><span class="label">Ecosystem Integrity:</span> The integrity of protected and conserved areas, accounting for degrees of human modification and habitat fragmentation.</li>
<li><span class="label">Ecological Connectivity:</span> The degree of connectivity and spatial linkages between protected and conserved areas.</li>
<li><span class="label">Ecosystem Services:</span> Provisioning and regulating services, with a specific focus on carbon storage and water services.</li>
</ul>
<strong>Purpose</strong>
<p>The layer was created to inform the EC Directorate General for International Partnerships (DG INTPA) and policymakers in selecting and prioritizing funding intervention areas based on specific targets (e.g., species conservation, connectivity, or water security) within different biogeographical regions. It serves as a spatial decision-support tool to align with the European Green Deal and the EU Biodiversity Strategy for 2030.</p>
<strong>Geographic Extent</strong>
<ul>
<li><span class="label">Region:</span> Sub-Saharan Africa</li>
<li><span class="label">Coverage:</span> 45 distinct Key Landscapes for Conservation and Development (KLCDs)</li>
</ul>
<strong>Keywords</strong>
<ul>
<li><span class="label">Thematic:</span> Biodiversity Conservation, NaturAfrica, Ecosystem Services, Protected Areas, Habitat Connectivity, Species Endemicity, European Green Deal, Ecosystem Integrity, Transfrontier Conservation, Mega-landscapes.</li>
<li><span class="label">Spatial:</span> Sub-Saharan Africa, Congo Basin, West Africa, East Africa, Southern Africa, Sudano-Sahelian zone.</li>
</ul>