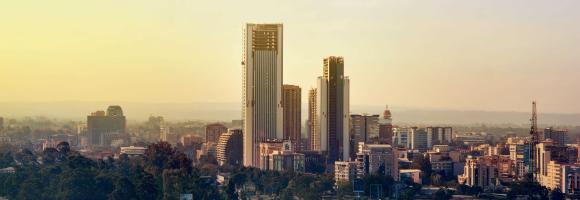
These layers present the application of the Degree of Urbanisation stage I methodology recommended by UN Statistical Commission to the global population grid generated by the JRC in the epochs 1975-2030 (5 years timestep).
The layers have been generated by integration of built-up surface extracted from Landsat and Sentinel-2 image data processing (GHS-BUILT-S R2023), and population data derived from the CIESIN GPW v4.11 (GHS-POP R2023).
The dataset is part the Global Human Settlement Layer, that provide global, high-resolution, multi-temporal gridded data on built-up environment (built-up surface, built-up volume, residential vs. non-residential function), resident population, and settlement classification by the UN-recommended methodology “degree of urbanisation”.
The complete information about the GHSL main products can be found in the GHSL Data Package 2023 report.
This dataset maps regions across Africa with high geothermal energy exploration potential, identifying areas where further research and investment are most likely to yield significant returns. The mapping represents a synthesis of the Indicator Analysis performed by TNO (Hofstra, 2023), specifically selecting the most and least favorable technical outcomes under the assumption of a clay-poor sandstone (CP) compaction model.
To ensure structural robustness and account for geological uncertainty, the indicator results have been projected onto four distinct geological basin models:
BGS TARGET Model: Projecting indicator values onto basin shapefiles defined by the British Geological Survey.
Evenick Model: Utilizing sedimentary basin structures characterized by surface porosity and thickness according to Evenick’s framework.
Getech Model: Integrating regional basin delineations to refine spatial prospectivity based on gravity and crustal structure data.
Robertson CGG Model: Applying indicator analysis to high-resolution basin geometries to evaluate technical performance.
Key Indicators & Methodology
The favorable results displayed in these maps are derived from a multi-criteria evaluation which includes:
Thermal Performance: Integration of the 3D conductive thermal model to identify viable reservoir temperatures at depth.
Reservoir Quality: Assessment of potential hydraulic transmissivity based on depth-dependent porosity and permeability for sedimentary aquifers.
Economic Viability: Calculations involving the Levelized Cost of Energy (LCOE) to distinguish areas where energy extraction is most cost-effective.
Malaria, a life-threatening disease transmitted by mosquitoes, affects millions of people worldwide. Treatment and prevention efforts such as insecticide-treated mosquito nets and rapid diagnostic tests significantly decreased the number of malaria cases in Africa. This layer displays the change in malaria rates (%) from 2000 to 2015 among children in Sub-Saharan Africa.
ETOPO 2022 global relief model, clipped from 30W to 60E and 40N to 40S.
Values are expressed in m.
This dataset is part of the LEAP-RE project collection. For more information visit https://www.leap-re.eu/
The GHS-BUILT-S spatial raster dataset depicts the distribution of the built-up (BU) surfaces estimates between 1975 and 2030 in 5 year intervals and two functional use components a) the total BU surface and b) the non-residential (NRES) BU surface. The data is made by spatial-temporal interpolation of five observed collections of multiple-sensor, multiple-platform satellite imageries: Landsat (MSS, TM, ETM sensor) data supports the 1975, 1990, 2000, and 2014 epochs, while a Sentinel-2 (S2) image composite (GHS-composite-S2 R2020A) supports the 2018 epoch.
This data represents the total BU surface (square meters) for year 2000 over cells of 1x1 km size.
The GHS-BUILT-S spatial raster dataset depicts the distribution of the built-up (BU) surfaces estimates between 1975 and 2030 in 5 year intervals and two functional use components a) the total BU surface and b) the non-residential (NRES) BU surface. The data is made by spatial-temporal interpolation of five observed collections of multiple-sensor, multiple-platform satellite imageries: Landsat (MSS, TM, ETM sensor) data supports the 1975, 1990, 2000, and 2014 epochs, while a Sentinel-2 (S2) image composite (GHS-composite-S2 R2020A) supports the 2018 epoch.
This data represents the total BU surface estimates (square meters) for year 2000 over cells of 100x100 m size.
This data represents the total built-up volume between 1975 and 2030 in 5 year intervals over cells of 1x1 km size.
It derives from the GHS-BUILT-V - R2023A spatial raster dataset, that depicts the distribution of built-up volumes, expressed as number of cubic metres. The data report about the total built-up volume and the built-up volume allocated to dominant non-residential (NRES) uses.
The dataset is part the Global Human Settlement Layer , Global, high-resolution, multi-temporal gridded data on built-up environment (built-up surface, built-up volume, residential vs. non-residential function), resident population, and settlement classification by the UN-recommended methodology “degree of urbanisation”.
The complete information about the GHSL main products can be found in the GHSL Data Package 2023 report
From the new available dataset in GFW on tree cover change between 2000 and 2020, here we are displaying the net change in tree cover by percent for country.The net change in tree cover corresponds to the area of gross gain minus the area of gross loss to show the overall change (negative or positive). The attribute table provides also statistics on net change in tree cover such stable forest or disturbed forest(in hectars).
This dataset is accessed through Global Forest Watch on 04/10/2022. www.globalforestwatch.org.
Potapov, P., Hansen, M.C., Pickens, A., Hernandez-Serna, A., Tyukavina, A., Turubanova, S., Zalles, V., Li, X., Khan, A., Stolle, F., Harris, N., Song, X-P., Baggett, A., Kommareddy, I., and Kommareddy, A. 2022. The Global 2000-2020 Land Cover and Land Use Change Dataset Derived From the Landsat Archive: First Results. Frontiers in Remote Sensing, 13, April 2022. https://doi.org/10.3389/frsen.2022.856903; summarized by administrative area at WRI
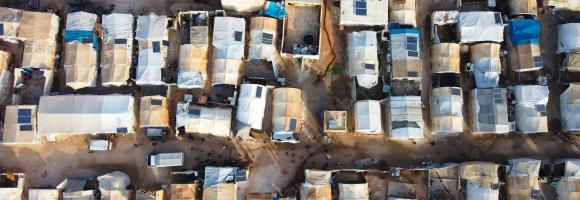
All known formal and informal settlements of forcibly displaced and stateless people in Africa from UNHCR’s GIS database as of November 2025. Population in the settlement. It may include several categories: Refugees, Returnees, IDP, Asylum-seeker, Stateless and Mixed.Formal Settlement: Formal settlements are places where official land is allocated for a group of asylum seekers, refugees, or IDPs. They are accommodated in purpose-built settlements with access to facilities and services. An official management entity is assigned. Camps are a type of formal settlement.
Informal Settlement: In an informal settlement, a group of asylum-seekers, refugees, or IDPs choose to settle in self-identified spontaneous sites. Self-settled settlements are often located on state-owned, private, or communal land, with or without negotiations with the local population or private landowners.
The dataset depicts the total energy demand per settlement (kWh/day) at year 5 under scenario with household consumption raised to 1000 Wh/day (at year 0). This dataset is part of the e Refugee Settlements Electricity Access (RSEA) database, designed and developed to gather the multidimensional factors that can determine a refugee settlement's energy dimension. These factors were chiefly environmental (such as variability of solar radiation and avoided GHG emissions), technical (electrification status, distance to grid), social (population, electricity demand, social infrastructure), and economic (e.g., PV mini-grid component prices) considerations that can influence a stakeholder decision on the deployment of a PV and battery storage mini-grid in a displacement setting.
This data represents the total built-up volume between 1975 and 2030 in 5 year intervals over cells of 1x1 km size.
It derives from the GHS-BUILT-V - R2023A spatial raster dataset, that depicts the distribution of built-up volumes, expressed as number of cubic metres. The data report about the total built-up volume and the built-up volume allocated to dominant non-residential (NRES) uses.
The dataset is part the Global Human Settlement Layer , Global, high-resolution, multi-temporal gridded data on built-up environment (built-up surface, built-up volume, residential vs. non-residential function), resident population, and settlement classification by the UN-recommended methodology “degree of urbanisation”.
The complete information about the GHSL main products can be found in the GHSL Data Package 2023 report
This data represents the distribution of human population between 1975 and 2030 in 5 year intervals over cells of 1x1 km size.
It derives from the GHS-POP - R2023A.
Residential population estimates between 1975 and 2020 in 5-year intervals and projections to 2025 and 2030 derived from CIESIN GPWv4.11 were disaggregated from census or administrative units to grid cells, informed by the distribution, volume, and classification of built-up as mapped in the Global Human Settlement Layer (GHSL) global layer per corresponding epoch.
The dataset is part the Global Human Settlement Layer, that provide global, high-resolution, multi-temporal gridded data on built-up environment (built-up surface, built-up volume, residential vs. non-residential function), resident population, and settlement classification by the UN-recommended methodology “degree of urbanisation”.
The complete information about the GHSL main products can be found in the GHSL Data Package 2023 report.
This data represents the distribution of human population between 1975 and 2030 in 5 year intervals over cells of 100x100 m size.
It derives from the GHS-POP - R2023A.
Residential population estimates between 1975 and 2020 in 5-year intervals and projections to 2025 and 2030 derived from CIESIN GPWv4.11 were disaggregated from census or administrative units to grid cells, informed by the distribution, volume, and classification of built-up as mapped in the Global Human Settlement Layer (GHSL) global layer per corresponding epoch.
The dataset is part the Global Human Settlement Layer, that provide global, high-resolution, multi-temporal gridded data on built-up environment (built-up surface, built-up volume, residential vs. non-residential function), resident population, and settlement classification by the UN-recommended methodology “degree of urbanisation”.
The complete information about the GHSL main products can be found in the GHSL Data Package 2023 report.