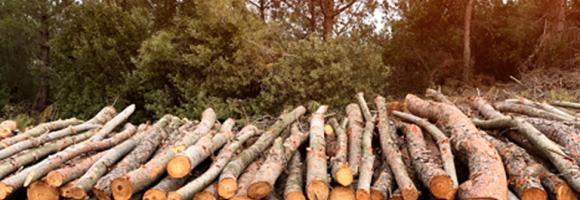
During the last twenty years (2000-2020) the intact forest landscapes extent within African, Caribbean and Pacific countries, decreased by 16% (237275km2).
However the protection of IFLs increased in the last two decades. Since 2000, around 100 conserved and protected areas were created in intact forests areas in ACP countries, increasing the percentage of IFL protected from 11% in 2000 to 26% in 2020.. Ethiopia has proposed six protected areas that will cover the total extent of IFL in the country. Republic of Congo increased IFL protection from 15,78% in 2000 to 67,07% in 2020.
Country
Percentage protected in 2000
Percentage protected in 2013
Percentage protected in 2016
Percentage protected in 2020
Angola
0.00
0.00
0
0.00
Belize
90.63
92.14
91.44447
91.99
Cote d'Ivoire
45.76
68.62
70.72509
82.37
Cameroon
98.89
99.96
99.96414
99.97
Central African Republic
14.20
39.23
47.47338
60.00
Congo
12.65
19.72
21.21028
22.03
Cuba
15.78
59.62
63.48035
67.07
Democratic Republic of the Congo
0.00
100.00
100
100.00
Dominican Republic
0.00
98.05
98.04902
98.05
Equatorial Guinea
1.07
0.00
0
0.00
Ethiopia
5.23
27.32
28.38109
29.74
Gabon
36.57
66.72
72.62826
73.61
Guyana
2.89
12.50
12.99736
13.25
Liberia
29.30
43.19
43.42341
54.63
Madagascar
34.84
39.28
37.74979
91.96
Nigeria
88.66
89.20
89.64465
91.54
Papua New Guinea
2.36
3.50
3.627328
4.61
Samoa
0.00
0.00
0
2.29
Solomon Islands
11.64
16.82
17.09852
18.69
Suriname
83.56
86.31
85.87311
95.55
Uganda
96.84
97.64
97.85507
98.25
United Republic of Tanzania
2.02
1.91
1.906882
1.92
Vanuatu
0.00
14.54
14.54262
14.48
Analysis performed by Simona Lippi
Reference:
Potapov, P., Hansen, M. C., Laestadius L., Turubanova S., Yaroshenko A., Thies C., Smith W., Zhuravleva I., Komarova A., Minnemeyer S., Esipova E. “The last frontiers of wilderness: Tracking loss of intact forest landscapes from 2000 to 2013” Science Advances, 2017; 3:e1600821
Critical natural assets are defined as the natural and semi-natural terrestrial and aquatic ecosystems required to maintain 12 of nature’s ‘local’ contributions to people (local NCP) on land. 12 Local NCP for key benefits like security in food, water, hazards, material and culture. as follows: for food, pollinator habitat sufficiency ofr pollination dependent crop production, fodder production for livestock, wild riverine and marine fish catch ; for water, water quality regulation, via sediment retention and nutrient retention; for natural hazards, flood risk reduction and coastal risk reduction. For materials, timber production, fuelwood production and access to nature. For cultural benefits, coral reef tourism and access to nature for recreation or other uses. Criticality of the natural assets was defined on the basis of the highest value areas across all NCPs, the magnitude of benefits and the number of beneficiaries. Cropland, urban areas, bare areas and permanent snow and ice are excluded from the analysis.
Organisms and non-living elements of the environment such as climate, soil, and water are connected through the movement of nutrients and energy in ecosystems. Ecosystems represent specific areas where organisms and environmental conditions create a network of interactions and are affected by forces such as disturbance (temporary change in environmental conditions that causes a pronounced change) and succession (process of change in the species structure of an ecological community over time). This layer maps the Ecosystems of Africa, based on Africa's climate regions, topography and lithology (bedrock), with a 100m spatial resolution.
This map provides a spatially explicit characterization of 47 terrestrial habitat types, as defined in the International Union for Conservation of Nature (IUCN) habitat classification scheme, which is widely used in ecological analyses, including for quantifying species’ Area of Habitat. The map broadens our understanding of habitats globally, assist in constructing area of habitat refinements, and are relevant for broad-scale ecological studies and future IUCN Red List assessments. Periodic updates are planned as better or more recent data becomes available.
This map provides a spatially explicit characterization of 47 terrestrial habitat types, as defined in the International Union for Conservation of Nature (IUCN) habitat classification scheme, which is widely used in ecological analyses, including for quantifying species’ Area of Habitat. The map broadens our understanding of habitats globally, assist in constructing area of habitat refinements, and are relevant for broad-scale ecological studies and future IUCN Red List assessments. Periodic updates are planned as better or more recent data becomes available.