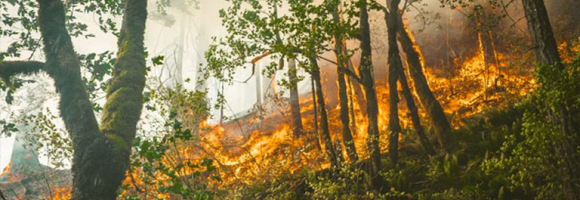
Vegetation fires have become a major concern in Africa because of their negative impacts on the environment and on human welfare. Uncontrolled (and un-prescribed) wildfires cause forest and vegetation degradation and related biodiversity loss, resulting in immediate and long-term impacts on the livelihoods of local communities and upstream impacts on national and regional economies. Fires in the tropical environment are a major contributor to tropical forest degradation and, if too frequent, can lead to savannisation of these areas. Vegetation fires are also a significant source of trace gases and aerosols in the atmosphere and contribute to the anticipated climate change, particularly with emissions of CO2. This layer shows the deviation of dekadal fire occurrences from the long-term average of the same 10-day period. A positive anomaly means more fire events than average for the last full 10-day period (red). A negative anomaly means less fire events than average for the last full 10-day period (green).
The Fraction of Photosynthetically Active Radiation Absorbed (FAPAR) is used to track the overall primary productivity associated with atmospheric CO2 fixation. FAPAR anomalies relative to the average between 2003 and 2010 show large surface variations, in terms of values and coverage, of vegetation productivity conditions over Africa. Temperature and precipitation deficits are the main drivers for the negative anomalies. Each location with a negative anomaly (FAPAR value lower than the long-term mean for that location – shades of red) indicates relative vegetation stress during that 10-day interval. Each location with a positive anomaly (FAPAR value higher than long-term mean for that location – shades of green) indicates relative favourable vegetation growth conditions during that 10-day interval. FAPAR values and their anomalies provide useful information for water and agricultural management purposes.
''Intact Forest Landscapes (IFLs) are defined as those with an unfragmented area of at least 500 km2 and which are minimally influenced by human economic activity''.(Thies et al. 2011) IFLs are critical for stabilizing terrestrial carbon storage, harboring biodiversity, regulating hydrological regimes, and providing other ecosystem functions. Researchers, firstly, created a global IFL map using existing fine-scale maps and a global coverage of high spatial resolution satellite imagery (Potapov et al. 2008). Moreover they assessed the distribution and dynamics of IFLs within the extent of present-day forest ecosystems tracking loss of intact forest landscapes from 2000 to 2020. In this layer we show the reduction of the IFL extent for African, Caribbean and Pacific (ACP)countries that decreased by 16,6% since the year 2000. Countries that experienced the largest reduction in intact forest landscape area over the past two decades are Solomon Islands with 66,3 %, Central African Republic with 57% and Equatorial Guinea with 50,4%. Democratic Republic of the Congo still has the highest proportion of intactness of ACP countries with 59,7Mha. IFL in Democratic Republic of the Congo has an extent of 64,3Mha as the 27,7% of its forest cover.
Earth magnetic anomaly grid derived from ship, airbone and satalite data, part of the EMAG2 V3 model.
Values are expressed in nT.
This dataset is part of the LEAP-RE project collection. For more information visit https://www.leap-re.eu/
This layer presents the Effective Leaf Area Index (LAIe) Anomalies, representing the deviation of current vegetation density from the historical average. Monitoring the change of LAI is essential for assessing the evolution of the vegetation over Africa.
LAI anomalies are calculated relative to the average values between 2003 and 2010. The dataset captures LAI anomalies every 10 days, reflecting the high variability and rapid changes in African vegetation cover.
Increases in temperature and precipitation deficits are the primary drivers for negative anomalies (reduced foliage density).
Beyond climatic factors, human activities or animal grazing may also locally impact the state and density of leaves.
This layer is part of the a href="https://fapar.jrc.ec.europa.eu/_www/index.php">Earth Land Information System (ELIS).
Fire is a natural part of all ecosystems. Wildfires have been burning vegetation and shaping landscapes far longer than people have been on Earth. However, changes in fire frequency and timing can result in degradation if the vegetation is not adapted to the new fire regimes. This can cause long-term damage to land biomass components affecting soil structure, nutrients and water cycling. This layer displays the areas of concern for fires related issues derived from the convergence of global evidence of human-environment interactions that can have consequences on land degradation.
The Fire Information for Resource Management System (FIRMS) of the National Aeronautics and Space Administration (NASA) uses satellite observations to detect active fires and thermal anomalies. They deliver this information to decision makers in near real-time (within 3 hours of satellite observation). This dataset includes active fires of the last 24h. Each point represents the centre of a 375 m resolution pixel where a fire was detected. It is updated twice daily. Compared to other coarser resolution (≥1km) satellite fire detection products, it provides improved response for smaller fires, improved mapping of large fire perimeters, and better detection at night, when fire activities usually occur. Consequently, the data are well suited for use in support of fire tracking and management (e.g., near real-time alert systems), as well as other science applications requiring improved fire mapping fidelity.
The Fire Information for Resource Management System (FIRMS) of the National Aeronautics and Space Administration (NASA) uses satellite observations to detect active fires and thermal anomalies. They deliver this information to decision makers in near real-time (within 3 hours of satellite observation). This dataset includes active fires of the last 48h. Each point represents the centre of a 375 m resolution pixel where a fire was detected. It is updated twice daily. Compared to other coarser resolution (≥1km) satellite fire detection products, it provides improved response for smaller fires, improved mapping of large fire perimeters, and better detection at night, when fire activities usually occur. Consequently, the data are well suited for use in support of fire tracking and management (e.g., near real-time alert systems), as well as other science applications requiring improved fire mapping fidelity.
The Fire Information for Resource Management System (FIRMS) of the National Aeronautics and Space Administration (NASA) uses satellite observations to detect active fires and thermal anomalies. They deliver this information to decision makers in near real-time (within 3 hours of satellite observation). This dataset includes active fires of the last 72h. Each point represents the centre of a 375 m resolution pixel where a fire was detected. It is updated twice daily. Compared to other coarser resolution (≥1km) satellite fire detection products, it provides improved response for smaller fires, improved mapping of large fire perimeters, and better detection at night, when fire activities usually occur. Consequently, the data are well suited for use in support of fire tracking and management (e.g., near real-time alert systems), as well as other science applications requiring improved fire mapping fidelity.
The Fraction of Absorbed Photosynthetically Active Radiation (FAPAR) is an Essential Climate Variable that serves as an integrated indicator of the status and health of plant canopies. FAPAR plays a critical role in the global carbon cycle and in determining primary productivity of the biosphere. Climate change affects the terrestrial ecosystem dynamics, but few of these dynamics are observable from space. FAPAR is monitored using space remote sensing techniques, allowing high resolution and near-real-time measures of the state and evolution of terrestrial vegetation dynamics.
Food crisis response planning can save lives if put in place in a timely manner. To do this, decision makers must be warned of climate extreme events impacting agricultural production. The Anomaly hotSpot of Agricultural Production tool (ASAP) is an online decision support system for early warning about hotspots of agricultural production anomaly (crop and rangeland), developed by the JRC for food security crises prevention and response planning anticipation. This map shows the frequency at which countries were classified as hotspots for agricultural production problems between 2004 and 2018. Hotspots are identified on a monthly basis.
Food crisis response planning can save lives if put in place in a timely manner. To do this, decision makers must be warned of climate extreme events impacting agricultural production. The Anomaly hotSpot of Agricultural Production tool (ASAP) is an online decision support system for early warning about hotspots of agricultural production anomaly (crop and rangeland), developed by the JRC for food security crises prevention and response planning anticipation. This map shows the frequency of ASAP anomaly warnings for crop growth for 2004-2018. It highlights the high sensitivity of the main agricultural areas in Northern Africa, the Horn of Africa and the Southern African Development Community to drought conditions.
Food crisis response planning can save lives if put in place in a timely manner. To do this, decision makers must be warned of climate extreme events impacting agricultural production. The Anomaly hotSpot of Agricultural Production tool (ASAP) is an online decision support system for early warning about hotspots of agricultural production anomaly (crop and rangeland), developed by the JRC for food security crises prevention and response planning anticipation. This map shows the frequency of ASAP anomaly warnings for rangeland growth for 2004-2018. It highlights the high sensitivity of the main agricultural areas in Northern Africa, the Horn of Africa and the Southern African Development Community to drought conditions.
This dataset maps the critical structural and tectonic features across Africa that serve as key indicators for geothermal resource potential. These layers delineate "fault/fracture zones" which are considered a primary geothermal resource play type for both magmatic and non-magmatic settings.
The layers in the dataset are:
Active faults (BGS) – derived from the Trans-African Regional Geo-data for the Energy Transition (TARGET) model of the British Geological Survey;
Active Faults GEM) – compilled as part of the GEM's global Probablistic Seismic Hazard modeling efforts;
Major faults – derived from the Trans-African Regional Geo-data for the Energy Transition (TARGET) model of the British Geological Survey;
Major faults - East-African Rift System - showing the location of major faults in the East-African Rift System, derived from Chrowicz (2005), part of the East African Rift Temperature and Heat flow model (EARTH).
These fault layers are crucial for characterizing subsurface hydraulic properties. Specifically, the dataset's features are utilized to:
Determine Permeability and Transmissivity: Active fault zones are modeled to have high fault/fracture permeability, accounting for a hydraulic transmissivity of 20 Darcy-meters up to a depth of 3 km.
Define Reservoir Thickness: For performance calculations, the corresponding "aquifer" permeability within these active fault zones is set to 10,000 mDarcy with an assumed thickness of 20 meters.
Model Geothermal Production: These structural features are integrated into the "resource fast model" as thin reservoirs for geothermal doublet systems (systems with at least one production and one injection well) situated in fractured basement or sedimentary rock.
Support Spatial Analysis: The locations of these active faults are rasterized and combined with 3D temperature grids (where magmatic areas and active volcanoes exhibit elevated heat production) to calculate local geothermal energy conversion scenarios across the continent.
Higher energy demands in Africa has led to a wide expansion of the number of hydropower sites, mainly between the 1960s and 1980s. The construction of dams causes impoundments of rivers and reservoirs in the regions of dam influence, with higher evaporation and water temperatures due to increased water surfaces. This map shows the he surface area (sqkm) of African reservoirs subject to hydropower production for the year 2016. It includes reservoirs of associated hydropower plants with installed capacities above 5MW. Apart from this, only reservoirs with a detected dam-caused impoundment of water surface are considered.
Monitoring of sea surface temperature (SST) provides fundamental information on the global climate system and for the study of marine ecosystems. This layer compares the SST value of the last full month with the long-term mean SST. A positive anomaly (warm colours) means the monthly SST is warmer than the long-term average for that month; a negative anomaly (cool colours) means it is cooler than the average.
Increasing water scarcity and water quality issues are serious constraints in Africa and worldwide. Measuring precipitation anomalies is important for detecting and characterizing meteorological droughts, and, in the agricultural sector especially, for effectively managing climate related uncertainties. This layer shows the deviation of the precipitations of the last full month from the long-term average of the same month. A positive anomaly (shades of blue) means there was more rainfall than average during that month. A negative anomaly (yellow to red) means there was less rainfall than average during that month.
Monitoring of sea surface temperature (SST) provides fundamental information on the global climate system and for the study of marine ecosystems. For example, it helps estimating heat stress conducive to coral bleaching, the process by which they expel the symbiotic algae living in their tissues and become white (bleached) and vulnerable. The NOAA Coral Reef Watch's daily global 5km satellite SST Anomaly (SSTA) compares the daily SST value with the long-term mean SST. A positive anomaly (+1.0 °C or more, warm colours) means the daily SST is warmer than the long-term average for that day; a negative anomaly (-1.0 °C or less, cold colours) means it is cooler than the average.
Agricultural drought events can affect large regions across the world. Soil moisture (or soil water content) is an important variable for plant growth, and - together with precipitation and evapotranspiration - is a basic component of the hydrological cycle. The Soil Moisture Anomaly (SMA) indicator is used to detect and monitor agricultural drought, that is when there is reduced crop production due to insufficient soil moisture. It is computed as a deviation from the climatological reference period, and is updated 3 times a month (after the 10th, the 20th and the last day of the month). This layer displays the map for the last full decade of the current month. Negative anomalies (shades of brown) represent dry conditions.
Magnetic anomaly map of Africa, derived from the World Digital Magnetic Anomaly map (WDMAM). Note that the blurry areas are interpolated due to source not containing data points.
Values are expressed in nT.
The WDMAM is an international scientific project under the auspices of IAGA (International Association of Geomagnetism and Aeronomy) and CGMW (Commission for the Geological Map of the World), aiming to compile and make available magnetic anomalies caused by the Earth lithosphere, on continental and oceanic areas, in a comprehensive way, all over the World.
This layer is part of the
Geothermal Atlas for Africa developed within the LEAP-RE project"
The hydropower installed capacity indicates the amount of energy a hydropower plant can produce in its turbines. In 2016, hydropower accounted for 54% of the installed capacity in Eastern Africa, 58% in Central Africa and 30% in Western Africa with fourteen countries having a hydropower share above 50% and eight countries above 70%. These highly hydropower-dependent countries are particularly prone to electricity cuts due to the lack of water caused by severe droughts. This map shows the location and installed capacities of hydropower plants above 5MW installed capacity in Africa for year 2016, representing 95% of the total hydropower installed capacity in Africa.
Chlorophyll-a concentrations (Chla) are an indicator of phytoplankton abundance and biomass in open waters. They can be an effective measure of trophic status and are commonly used to measure water quality. This layer compares the Chla value from the last full month with the long-term mean Chla. A positive anomaly (warm colours) means the monthly Chla is higher than the long-term average for that month; a negative anomaly (cool colours) means it is lower than the average.
Normalized Difference Vegetation Index (NDVI), Leaf Array Index (LAI), and Fraction of Absorbed photosynthetic Radiation (FAPAR) timeseries information from eStation services.