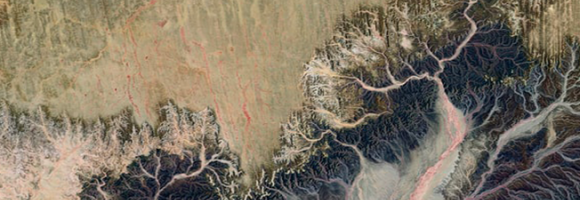
The Africa Topographic Potisiont layer classifies the African landscape (including Madagascar, Comoros Islands, and other coastal Islands near continenal Africa) into uplands and lowlands/depressions at a 100m resolution. Published by the USGS in 2009, this dataset was created for the Africa Terrestrial Ecosystems mapping project. The classification is derived from the Compound Topographic Index (CTI) , which integrates slope (from SRTM elevation data) and flow accumulation (from HydroSHEDS data) to model potential water flow.
This dataset maps the critical structural and tectonic features across Africa that serve as key indicators for geothermal resource potential. These layers delineate "fault/fracture zones" which are considered a primary geothermal resource play type for both magmatic and non-magmatic settings.
The layers in the dataset are:
Active faults (BGS) – derived from the Trans-African Regional Geo-data for the Energy Transition (TARGET) model of the British Geological Survey;
Active Faults GEM) – compilled as part of the GEM's global Probablistic Seismic Hazard modeling efforts;
Major faults – derived from the Trans-African Regional Geo-data for the Energy Transition (TARGET) model of the British Geological Survey;
Major faults - East-African Rift System - showing the location of major faults in the East-African Rift System, derived from Chrowicz (2005), part of the East African Rift Temperature and Heat flow model (EARTH).
These fault layers are crucial for characterizing subsurface hydraulic properties. Specifically, the dataset's features are utilized to:
Determine Permeability and Transmissivity: Active fault zones are modeled to have high fault/fracture permeability, accounting for a hydraulic transmissivity of 20 Darcy-meters up to a depth of 3 km.
Define Reservoir Thickness: For performance calculations, the corresponding "aquifer" permeability within these active fault zones is set to 10,000 mDarcy with an assumed thickness of 20 meters.
Model Geothermal Production: These structural features are integrated into the "resource fast model" as thin reservoirs for geothermal doublet systems (systems with at least one production and one injection well) situated in fractured basement or sedimentary rock.
Support Spatial Analysis: The locations of these active faults are rasterized and combined with 3D temperature grids (where magmatic areas and active volcanoes exhibit elevated heat production) to calculate local geothermal energy conversion scenarios across the continent.
This dataset provides the hydrological boundaries for major river basins and sub-basins across the African continent. Developed by the FAO Land and Water Division under the AQUASTAT program, the data delineates Africa’s drainage systems based on a hydrologically corrected Digital Elevation Model (DEM) at a 1 km resolution.
Designed for use within GIS-based water resource information systems, this dataset serves as a foundational layer for analyzing African hydrology. It was originally published as part of the FAO Land and Water Digital Media Series #13: "Atlas of Water Resources and Irrigation in Africa."
The map is based on Copernicus Global Land Cover data which shows actual land cover (what physically covers land across the globe—forests, grasslands, croplands, lakes, wetlands, built-up area, etc) at 100m x 100m resolution. The land cover data for Africa was overlaid on (high resolution) satellite imagery of Africa, which is then used to determine the land use (by visual interpretation) associated with the various land cover patterns on the Copernicus Global Land Cover map.
Copernicus land cover data offers several advantages: it is of high quality, has a high resolution (100m x 100m), and offers time series satellite imagery. More importantly, the Copernicus Global Land Service is a continuous process and its datasets are updated annually. This means that the Soils4Africa map of agricultural land can be updated every time the land cover data for the new year becomes available (the map is currently based on 2019 data).
The Copernicus dataset already includes the category ‘cropland,’ which by definition is part of agricultural land. The Soils4Africa map broadens the scope of that dataset by infering information on agricultural use and including other kinds of agricultural land use such as grazing pastures and plantations.
When land is mapped as other than ‘cropland'-- like ‘shrubland’ for example-- it is more difficult to interpret and determine whether it is under agricultural use. The Copernicus dataset includes information about ‘fractional cover’-- or the percentage of a particular pixel under a particular kind of land cover (for example, 30% of a 100m x 100m pixel could be forest and 20% could be shrubland). The Soils4Africa map takes into account how fractional cover varies over an area to establish rules for interpreting its land cover data to determine whether it is under agricultural use and for what purpose. These rules were validated by comparing it with ground level information on land use (or land use pattern) for specific areas drawn from the interpretation of satellite imagery from Google Earth.
For example, ground-level observation shows that forest cover upwards of 30% in a given area when matched by shrubland cover of over 30%, is characterized by woody vegetation with a smooth canopy. Therefore, such area is more likely to be under plantations rather than natural forest. Thus, such an area should be counted as agricultural land, even if less than 15% of it is under crops.
Organisms and non-living elements of the environment such as climate, soil, and water are connected through the movement of nutrients and energy in ecosystems. Ecosystems represent specific areas where organisms and environmental conditions create a network of interactions and are affected by forces such as disturbance (temporary change in environmental conditions that causes a pronounced change) and succession (process of change in the species structure of an ecological community over time). This layer maps the Ecosystems of Africa, based on Africa's climate regions, topography and lithology (bedrock), with a 100m spatial resolution.
The world is shrinking. Cheap flights, large scale commercial shipping and expanding road networks all mean that we are better connected to everywhere else than ever before. Accessibility - whether it is to markets, schools, hospitals or water - is a precondition for the satisfaction of almost any economic need. The new map of Travel Time to Major Cities -developed by the European Commission and the World Bank- captures this connectivity and the concentration of economic activity. It also highlights that there is little wilderness left. The map shows the travel time (in hours/days) to major cities (i.e. cities of 50,000 or more people in year 2000) using land (road/off road) or water (navigable river, lake and ocean) based travel.
Shapefile showing the location, status, hight and type of volcanoes in Africa that are thought to have been active in the past 10000 years (Holocene). From the Smithsonian Institution, Global Volcanism Program, American Geological Institute, Geological Survey (U.S.) and Environmental Systems Research Institute (Redlands, Calif.)
This dataset is part of the LEAP-RE project collection. For more information visit https://www.leap-re.eu/
This dataset provides a continent-wide, raster-based spatial representation of Earth's surface heat flow across the African tectonic plate for the year 2013, modeled under a historical baseline scenario. The data quantifies the amount of thermal energy moving from the Earth's interior to its surface, with values explicitly expressed in watts per square meter (W/m²). This resource is critical for identifying geothermal potential, understanding tectonic anomalies, and supporting broader geoscientific and energy research.
This dataset comprises a collection of shapefiles detailing the geographical locations and attributes of various wells across Africa, with a strong focus on geothermal exploration and assessment. Together, these layers offer a valuable resource for geothermal energy planning, subsurface geological analysis, and infrastructure mapping. The collection includes the following spatial data layers:
Wells: Maps the locations of various existing well types and provides critical geothermal metrics where available, including well names, temperature correction states, thermal gradients, heat flow, and heat production data.
BGS Well: A compiled spatial layer derived from scientific literature that categorizes well locations and types.
Planned wells: Highlights the prospective locations of future geothermal wells across the continent.
This dataset compiles geophysical models detailing the thickness of the Earth's outer layers, ranging from surface sedimentary basins down to the base of the lithosphere. The collection serves a dual purpose: it provides broad, global baseline data for sediment distribution, while also offering high-resolution, integrated regional models specifically focused on the African plate.
Dataset Contents:
I. Global Baselines
Global Sediment Thickness (Laske & Masters, 2013): The global sediment thickness baseline extracted from the CRUST1.0 model. This provides broad, foundational coverage across both continental and oceanic domains. (Values expressed in km).
Global Oceanic Sediment Thickness (Straume et al., 2019): A high-resolution, 5-arc-minute grid detailing total sediment thickness specifically for the world's oceans and marginal seas, compiled from extensive new data and previous work. (Values expressed in m).
II. African Regional Models
Combined Sediment Thickness (Africa): A synthesized, optimized sedimentary thickness map for Africa and its surrounding regions. This layer intelligently merges the Laske & Masters (2013) and Straume et al. (2019) maps, prioritizing the Straume data wherever overlaps occur to maximize resolution. (Values expressed in m).
Crustal Thickness (Globig et al., 2016): An Africa-specific crustal thickness map derived from the integrated modeling of elevation, geoid data, and rigorous thermal analysis. (Values expressed in km).
Lithosphere Thickness (Globig et al., 2016): An Africa-specific lithospheric thickness map, complementing the crustal layer, derived using the same integrated elevation, geoid, and thermal modeling approach. (Values expressed in km).
This dataset shows the location of hydrocarbon provinces with proven petroleum reserves. This data was compiled as part of the USGS's World Energy Project (WEP).
This dataset is part of the LEAP-RE project collection. For more information visit https://www.leap-re.eu/