Reference evapotranspiration (Global - Monthly - ~10 km) August 2025- AQUASTAT (FAO) AgERA5 derived.
Reference evapotranspiration per month with a spatial resolution of 0.1 degree. Unit: mm month-1. The dataset contains monthly values for global land areas, excluding Antarctica, since 1979. The dataset has been prepared according to the FAO Penman - Monteith method as described in FAO Irrigation and Drainage Paper 56.
https://data.apps.fao.org/catalog/dataset/c91430cc-681e-4ca8-a5f4-8c97dc92c547/resource/ff49908e-2e07-48b3-8deb-0c69af411859
This dataset compiles geophysical models detailing the thickness of the Earth's outer layers, ranging from surface sedimentary basins down to the base of the lithosphere. The collection serves a dual purpose: it provides broad, global baseline data for sediment distribution, while also offering high-resolution, integrated regional models specifically focused on the African plate.
Dataset Contents:
I. Global Baselines
Global Sediment Thickness (Laske & Masters, 2013): The global sediment thickness baseline extracted from the CRUST1.0 model. This provides broad, foundational coverage across both continental and oceanic domains. (Values expressed in km).
Global Oceanic Sediment Thickness (Straume et al., 2019): A high-resolution, 5-arc-minute grid detailing total sediment thickness specifically for the world's oceans and marginal seas, compiled from extensive new data and previous work. (Values expressed in m).
II. African Regional Models
Combined Sediment Thickness (Africa): A synthesized, optimized sedimentary thickness map for Africa and its surrounding regions. This layer intelligently merges the Laske & Masters (2013) and Straume et al. (2019) maps, prioritizing the Straume data wherever overlaps occur to maximize resolution. (Values expressed in m).
Crustal Thickness (Globig et al., 2016): An Africa-specific crustal thickness map derived from the integrated modeling of elevation, geoid data, and rigorous thermal analysis. (Values expressed in km).
Lithosphere Thickness (Globig et al., 2016): An Africa-specific lithospheric thickness map, complementing the crustal layer, derived using the same integrated elevation, geoid, and thermal modeling approach. (Values expressed in km).
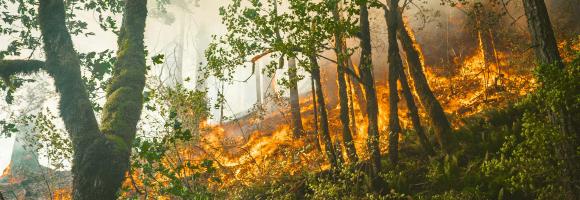
The Copernicus Global Land Service - Burnt Area products depict burn scars, surfaces which have been sufficiently affected by fire to display significant changes in the vegetation cover (destruction of dry material, reduction or loss of green material) and in the ground surface (temporarily darker because of ash). The monthly products are available at global scale in the spatial resolution of 300 m and cover the period from January 2019 to April 2022. The pixel bears the value of the day of the year in which the burn scars were visible while, if selected for mapping in this platform, the dataset shows the burn scars detected in the selected month.
Percentage of children 24-35 months who had received all age appropriate vaccinations. The lower the number of vaccinated children, the more beneficial decentralised renewable energy solutions may be in providing electricity to store vaccines in proper refrigerators.
At any given place on Earth, complex human-environment interactions are at play. They include differing rates and magnitudes of drivers (e.g. overgrazing, climate change, agricultural practices) and differing consequences in land degradation (e.g. soil erosion, changes in productivity, loss of biodiversity). The occurrence of multiple global change issues at a location suggests a potential for land degradation, at least in some form. This layer depicts where global change issues relevant to land degradation coincide at a global scale. It helps identifying local or regional areas of concern where land degradation processes may be underway.
Whether you’re monitoring crops, modelling green energy installations or soil sealing, combatting loss of natural resources or just helping countries meet their Sustainable Development Goals, chances are high that you’ll need an accurate and spatially detailed map on land cover and land use. Earth Observation satellites, like those from EU’s flagship programme Copernicus, are key to providing such maps, at a global scale, with free and open access. Land cover maps represent spatial information on different types (classes) of physical coverage of the Earth's surface, e.g. forests, grasslands, croplands, lakes, wetlands. Dynamic land cover maps include transitions of land cover classes over time and hence captures land cover changes. This dataset shows the land cover for the baseline year 2019 with a discrete classification in 23 classes aligned with UN-FAO's Land Cover Classification System.
This dataset shows the global distribution of coral reefs in tropical and
subtropical regions. It is the most comprehensive global dataset of
warm-water coral reefs to date, acting as a foundation baseline map for
future, more detailed, work. This dataset was compiled from a number
of sources by UNEP World Conservation Monitoring Centre (UNEPWCMC) and the WorldFish Centre, in collaboration with WRI (World
Resources Institute) and TNC (The Nature Conservancy). Data sources
include the Millennium Coral Reef Mapping Project (IMaRS-USF and IRD
2005, IMaRS-USF 2005) and the World Atlas of Coral Reefs (Spalding et
al. 2001).
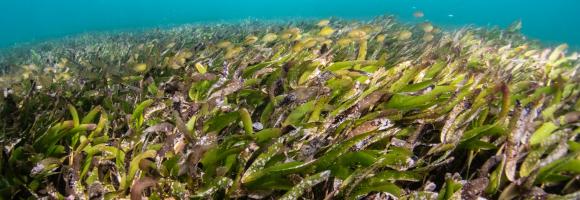
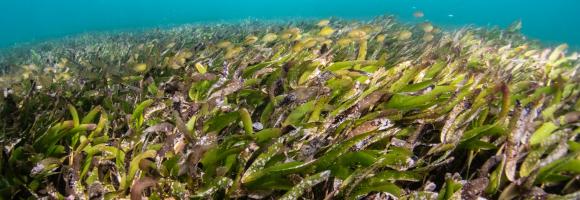
Seagrass is found on all continents except Antarctica, covering roughly 0.1% of the ocean floor. However, its global extent remains inadequately mapped, with estimates varying between 160,387 km² and 670,000 km², posing a significant challenge for conservation efforts. The UNEP-WCMC seagrass dataset indicates that Africa harbors approximately 12% of the world’s seagrass.
Seagrass is found on all continents except Antarctica, covering roughly 0.1% of the ocean floor. However, its global extent remains inadequately mapped, with estimates varying between 160,387 km² and 670,000 km², posing a significant challenge for conservation efforts. The UNEP-WCMC seagrass dataset indicates that Africa harbors approximately 12% of the world’s seagrass.
The Global Gridded Relative Deprivation Index (GRDI) characterizes the relative levels of multidimensional deprivation and poverty, where a value of 100 represents the highest level of deprivation and a value of 0 the lowest. GRDI is built from sociodemographic and satellite data inputs that were spatially harmonized, indexed, and weighted into six main components to produce the final GRDI layer.
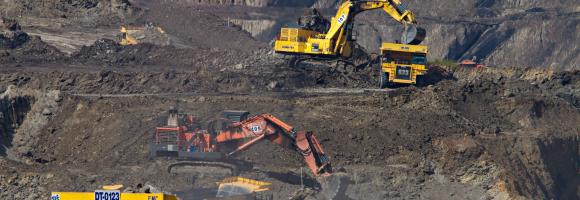
Mining has major economic, environmental and societal consequences, yet knowledge and understanding of its global footprint are still limited. These polygons represent the global mining land use detected via remote sensing analysis of high-resolution, publicly available satellite imagery. The dataset comprises 74,548 polygons, covering ~66,000 km2 of features like waste rock dumps, pits, water ponds, tailings dams, heap leach pads and processing/milling infrastructure.
Map showing global seismic hazard areas. This Global Seismic Hazard Map depicts Peak
Ground Acceleration (PGA) with a 10% chance of exceedance in 50
years. The data is collected as part of the Global Seismic Hazard Assessment Program (GSHAP). Here, an homogeneous approach of data collection is performed in different regions. The data was later combined in one map as an mosaic like structure. For more information please check out the source.
Values are expressed in m/s^2.
This dataset is part of the LEAP-RE project collection. For more information visit https://www.leap-re.eu/
Chlorophyll-a concentrations (Chla) are an indicator of phytoplankton abundance and biomass in open waters. They can be an effective measure of trophic status and are commonly used to measure water quality. This layer compares the Chla value from the last full month with the long-term mean Chla. A positive anomaly (warm colours) means the monthly Chla is higher than the long-term average for that month; a negative anomaly (cool colours) means it is lower than the average.
Monitoring of sea surface temperature (SST) provides fundamental information on the global climate system and for the study of marine ecosystems. This layer compares the SST value of the last full month with the long-term mean SST. A positive anomaly (warm colours) means the monthly SST is warmer than the long-term average for that month; a negative anomaly (cool colours) means it is cooler than the average.
Increasing water scarcity and water quality issues are serious constraints in Africa and worldwide. Measuring precipitation anomalies is important for detecting and characterizing meteorological droughts, and, in the agricultural sector especially, for effectively managing climate related uncertainties. This layer shows the deviation of the precipitations of the last full month from the long-term average of the same month. A positive anomaly (shades of blue) means there was more rainfall than average during that month. A negative anomaly (yellow to red) means there was less rainfall than average during that month.
This layer shows the percentage of children under 6 months who are exclusively breastfed, meaning they receive only breast milk without any additional food or drink. Exclusive breastfeeding is a key determinant of child survival, growth, and development.
African countries have an evident potential for solar energy. Knowing the amount of solar radiation reaching the earth's surface is of particular interest for photovoltaic installations. It can be represented by the Global Horizontal Irradiation: the total amount of energy received from the Sun by a surface horizontal to the ground during a period of time, expressed in Wh/m2. This map shows the yearly average (2005-2015) global horizontal irradiation (kWh/m2).
This dataset provides a continent-wide, raster-based spatial representation of Earth's surface heat flow across the African tectonic plate for the year 2013, modeled under a historical baseline scenario. The data quantifies the amount of thermal energy moving from the Earth's interior to its surface, with values explicitly expressed in watts per square meter (W/m²). This resource is critical for identifying geothermal potential, understanding tectonic anomalies, and supporting broader geoscientific and energy research.
The current version of the GDW database (version 1.0) aims to catalogue all types of anthropogenic instream barriers. While initial mapping efforts prioritize major dams that form reservoirs, as well as run-of-river barriers on larger rivers where more information is readily available, the dataset comprises two distinct but interconnected spatial layers:
Barrier and Dam Locations (Point Layer): Contains barrier and dam locations, geospatially referenced as point coordinates and co-registered to the global river network of HydroSHEDS.
Reservoir Extents (Polygon Layer): Contains associated reservoir polygons, which includes data representing the maximum storage capacity of the reservoirs measured in million cubic meters.
The EC JRC global map of forest cover provides a spatially explicit representation of forest presence and absence for the year 2020 at 10m spatial resolution.
The year 2020 corresponds to the cut-off date of the Regulation from the European Union "on the making available on the Union market and the export from the Union of certain commodities and products associated with deforestation and forest degradation" (EUDR, Regulation (EU) 2023/1115). In the context of the EUDR, the global forest cover map can be used as a non-mandatory, non-exclusive, and not legally binding source of information. Further information about the map and its use can be found on the EU Observatory on Deforestation and Forest Degradation (EUFO) in the section on Frequently Asked Questions.
Forest means land spanning more than 0.5 hectares with trees higher than 5 meters and a canopy cover of more than 10%, or trees able to reach those thresholds in situ, excluding land that is predominantly under agricultural or urban land use. Agricultural use means the use of land for the purpose of agriculture, including for agricultural plantations (i.e. tree stands in agricultural production systems such as fruit tree plantations, oil palm plantations, olive orchards and agroforestry systems) and set- aside agricultural areas, and for rearing livestock. All plantations of relevant commodities other than wood, that is cattle, cocoa, coffee, oil palm, rubber, soya, are excluded from the forest definition.
The global map of forest cover was created by combining available global datasets (wall-to-wall or global in their scope) on tree cover, tree height, land cover and land use into a single harmonized globally-consistent representation of where forests existed in 2020.
The workflow consisted in first mapping the global maximum extent of tree cover circa the year 2020 from the combination of ESA World Cover 2020 and 2021, WRI Tropical Tree Cover 2020, UMD Global land cover and land use 2019, Global Mangrove Watch 2020, and JRC Tropical Moist Forest 2020 datasets. In the second step, a series of overlays and decision rules were applied to reduce this maximum extent of tree cover and align it with the Forest definition using datasets covering cropland and commodity expansion (ESA World Cereal, UMD Global land cover and land use 2019, UMD Global Cropland Expansion, High-resolution global map of smallholder and industrial oil palm plantations, and WRI Spatial Database of Planted Trees), land use change (UMD global forest cover loss, JRC Tropical Moist Forest, IIASA Global Forest Management), built-up (JRC Global Human Settlement), and water (JRC Global Surface Water).
The detailed mapping approach will be described in a separate technical report expected to be released by March 2024. The accuracy of this map has not been yet assessed but will be reported as soon as available.
Normalized Difference Vegetation Index (NDVI), Leaf Array Index (LAI), and Fraction of Absorbed photosynthetic Radiation (FAPAR) timeseries information from eStation services.