Main navigation
User account menu
Language
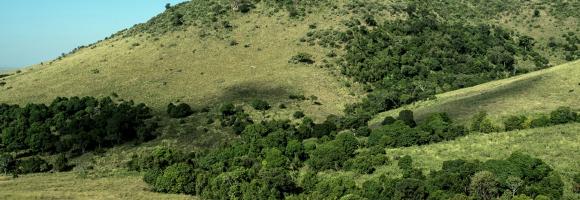
The EC JRC global map of forest cover provides a spatially explicit representation of forest presence and absence for the year 2020 at 10m spatial resolution.
The year 2020 corresponds to the cut-off date of the Regulation from the European Union "on the making available on the Union market and the export from the Union of certain commodities and products associated with deforestation and forest degradation" (EUDR, Regulation (EU) 2023/1115). In the context of the EUDR, the global forest cover map can be used as a non-mandatory, non-exclusive, and not legally binding source of information. Further information about the map and its use can be found on the EU Observatory on Deforestation and Forest Degradation (EUFO) in the section on Frequently Asked Questions.
Forest means land spanning more than 0.5 hectares with trees higher than 5 meters and a canopy cover of more than 10%, or trees able to reach those thresholds in situ, excluding land that is predominantly under agricultural or urban land use. Agricultural use means the use of land for the purpose of agriculture, including for agricultural plantations (i.e. tree stands in agricultural production systems such as fruit tree plantations, oil palm plantations, olive orchards and agroforestry systems) and set- aside agricultural areas, and for rearing livestock. All plantations of relevant commodities other than wood, that is cattle, cocoa, coffee, oil palm, rubber, soya, are excluded from the forest definition.
The global map of forest cover was created by combining available global datasets (wall-to-wall or global in their scope) on tree cover, tree height, land cover and land use into a single harmonized globally-consistent representation of where forests existed in 2020.
The workflow consisted in first mapping the global maximum extent of tree cover circa the year 2020 from the combination of ESA World Cover 2020 and 2021, WRI Tropical Tree Cover 2020, UMD Global land cover and land use 2019, Global Mangrove Watch 2020, and JRC Tropical Moist Forest 2020 datasets. In the second step, a series of overlays and decision rules were applied to reduce this maximum extent of tree cover and align it with the Forest definition using datasets covering cropland and commodity expansion (ESA World Cereal, UMD Global land cover and land use 2019, UMD Global Cropland Expansion, High-resolution global map of smallholder and industrial oil palm plantations, and WRI Spatial Database of Planted Trees), land use change (UMD global forest cover loss, JRC Tropical Moist Forest, IIASA Global Forest Management), built-up (JRC Global Human Settlement), and water (JRC Global Surface Water).
The detailed mapping approach will be described in a separate technical report expected to be released by March 2024. The accuracy of this map has not been yet assessed but will be reported as soon as available.
Please also refer to the list of known issues and to the JRC Data Catalogue entry.

Tropical moist forests have a huge environmental value. They play an important role in biodiversity conservation, terrestrial carbon cycle, hydrological regimes, indigenous population subsistence and human health (1-5). They are increasingly recognized as an essential element of any strategy to mitigate climate change. Accurate characterization of the tropical moist forests changes is needed to support conservation policies and to better quantify their contribution to global carbon fluxes. This map shows the coverage of undisturbed tropical moist forests remaining at the end of the year 2019.

''Intact Forest Landscapes (IFLs) are defined as those with an unfragmented area of at least 500 km2 and which are minimally influenced by human economic activity''.(Thies et al. 2011) IFLs are critical for stabilizing terrestrial carbon storage, harboring biodiversity, regulating hydrological regimes, and providing other ecosystem functions. Researchers, firstly, created a global IFL map using existing fine-scale maps and
a global coverage of high spatial resolution satellite imagery (Potapov et al. 2008). Moreover they assessed the distribution and dynamics of IFLs within the extent of present-day forest ecosystems tracking loss of intact forest landscapes from 2000 to 2020. In this layer we show the reduction of the IFL extent for African, Caribbean and Pacific (ACP)countries that decreased by 16,6% since the year 2000. Countries that experienced the largest reduction in intact forest landscape area over the past two decades are Solomon Islands with 66,3 %, Central African Republic with 57% and Equatorial Guinea with 50,4%. Democratic Republic of the Congo still has the highest proportion of intactness of ACP countries with 59,7Mha. IFL in Democratic Republic of the Congo has an extent of 64,3Mha as the 27,7% of its forest cover.
| Country | IFL Area in 2000 (sqkm) | IFL Area in 2020 (sqkm) | Percentage of IFL reduction |
| Angola | 2913.32 | 1752.85 | 39.83 |
| Belize | 4275.28 | 3598.44 | 15.83 |
| Cote d'Ivoire | 4558.78 | 3760.48 | 17.51 |
| Cameroon | 52752.96 | 31968.77 | 39.40 |
| Central African Republic | 8695.96 | 3727.14 | 57.14 |
| Congo | 138699.28 | 100215.44 | 27.75 |
| Cuba | 544.02 | 544.02 | 0.00 |
| Democratic Republic of the Congo | 643864.37 | 597275.75 | 7.24 |
| Dominican Republic | 795.21 | 564.89 | 28.96 |
| Equatorial Guinea | 4249.57 | 2104.83 | 50.47 |
| Ethiopia | 3671.63 | 3233.76 | 11.93 |
| Gabon | 108838.30 | 76291.78 | 29.90 |
| Guyana | 144296.97 | 117327.95 | 18.69 |
| Liberia | 4748.74 | 2880.65 | 39.34 |
| Madagascar | 17240.16 | 10799.08 | 37.36 |
| Nigeria | 2959.07 | 2416.10 | 18.35 |
| Papua New Guinea | 159523.52 | 127121.71 | 20.31 |
| Samoa | 650.86 | 643.16 | 1.18 |
| Solomon Islands | 7820.33 | 2630.05 | 66.37 |
| Suriname | 107282.59 | 92574.26 | 13.71 |
| Uganda | 984.66 | 962.06 | 2.30 |
| United Republic of Tanzania | 4081.92 | 3796.32 | 7.00 |
| Vanuatu | 706.13 | 688.33 | 2.52 |
An intact forest landscape (IFL) is a seamless mosaic of forest and naturally treeless ecosystems with no remotely detected signs of human activity and a minimum area of 500 km2. (Potapov et al.2017) Intact forests are complex and diverse ecosystems that if lost, are irreplaceable. Research shows that designating intact forest landscapes as protected areas has proven effective at limiting their fragmentation. Since 2000, around 100 conserved and protected areas were created in intact forests areas in ACP countries, increasing the percentage of IFL protected from 11% in 2000 to 26% in 2020.
Differences in countries in terms of IFL area reduction: Cuba has not experienced any reduction in IFLs and nowadays its intact forests are fully protected by PAs (544sqkm). At the contrary Angola still not has any kind of protection for its IFLs and experienced a reduction of 39,83% of its IFL (1160 sqkm) in country.The reduction of IFL area in ACP countries was higher outside PAs (19%) than within PAs (5%).Madagascar is the country where the reduction of IFL areas was very high inside protected areas (2420 sqkm). The IFL loss inside PAs has been more than 40% between 2000 and 2020. Central African Republic experienced 23% of reduction inside PAs (938,13 sqkm). This layer shows the percentage of IFLs protected by country
| Country | IFL protected 2020 (sqkm) | IFL unprotected 2020 (sqkm) | Percentage of IFL protected 2020 | Percentage of IFL unprotected 2020 |
| Angola | 0.00 | 1752.85 | 0.00 | 100.00 |
| Belize | 3310.17 | 288.36 | 91.99 | 8.01 |
| Cameroon | 19181.16 | 12787.52 | 60.00 | 40.00 |
| Central African Republic | 3070.21 | 656.90 | 82.37 | 17.62 |
| Congo | 67218.88 | 32997.23 | 67.07 | 32.93 |
| Cote d'Ivoire | 3759.21 | 1.27 | 99.97 | 0.03 |
| Cuba | 544.02 | 0.00 | 100.00 | 0.00 |
| Democratic Republic of the Congo | 131588.22 | 465687.18 | 22.03 | 77.97 |
| Dominican Republic | 553.86 | 11.03 | 98.05 | 1.95 |
| Equatorial Guinea | 1549.39 | 555.44 | 73.61 | 26.39 |
| Ethiopia | 0 | 3233.7 | 0 | 100 |
| Gabon | 22692.90 | 53598.80 | 29.74 | 70.26 |
| Guyana | 15545.93 | 101781.93 | 13.25 | 86.75 |
| Liberia | 1573.69 | 1306.95 | 54.63 | 45.37 |
| Madagascar | 9931.34 | 867.74 | 91.96 | 8.04 |
| Nigeria | 2211.75 | 204.39 | 91.54 | 8.46 |
| Papua New Guinea | 5863.48 | 121258.17 | 4.61 | 95.39 |
| Samoa | 93.13 | 550.03 | 14.48 | 85.52 |
| Solomon Islands | 60.11 | 2569.93 | 2.29 | 97.71 |
| Suriname | 17304.85 | 75269.36 | 18.69 | 81.31 |
| Uganda | 945.21 | 16.84 | 98.25 | 1.75 |
| United Republic of Tanzania | 3627.46 | 168.85 | 95.55 | 4.45 |
| Vanuatu | 13.24 | 675.08 | 1.92 | 98.08 |
Analysis performed by Simona Lippi
Forest canopy height measures the average height of the tree canopy in 2012. This dataset is created by integrating broadscale optical remotely sensed data at 30-metre spatial resolution with on-the-ground measurements.

This layer maps the distribution of diverse geothermal play types categorized by:
Location: Precise spatial boundaries of geothermal provinces.
Geodynamic Setting: Classification by tectonic regime.
Play Type: Categorization based on heat source and fluid transport mechanisms.
Energy Application: Indication of suitability for power production or direct-use applications.
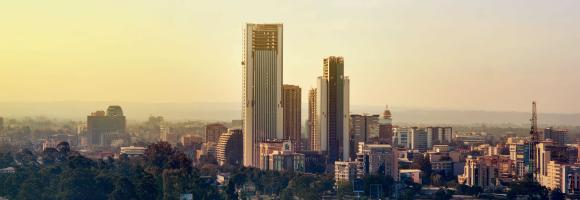
The GHS-BUILT-S spatial raster dataset depicts the distribution of the built-up (BU) surfaces estimates between 1975 and 2030 in 5 year intervals and two functional use components a) the total BU surface and b) the non-residential (NRES) BU surface. The data is made by spatial-temporal interpolation of five observed collections of multiple-sensor, multiple-platform satellite imageries: Landsat (MSS, TM, ETM sensor) data supports the 1975, 1990, 2000, and 2014 epochs, while a Sentinel-2 (S2) image composite (GHS-composite-S2 R2020A) supports the 2018 epoch.
This data represents the total BU surface (square meters) for year 2020 over cells of 1x1 km size.
The GHS-BUILT-S spatial raster dataset depicts the distribution of the built-up (BU) surfaces estimates between 1975 and 2030 in 5 year intervals and two functional use components a) the total BU surface and b) the non-residential (NRES) BU surface. The data is made by spatial-temporal interpolation of five observed collections of multiple-sensor, multiple-platform satellite imageries: Landsat (MSS, TM, ETM sensor) data supports the 1975, 1990, 2000, and 2014 epochs, while a Sentinel-2 (S2) image composite (GHS-composite-S2 R2020A) supports the 2018 epoch.
This data represents the total BU surface estimates (square meters) for year 2020 over cells of 100x100 m size.
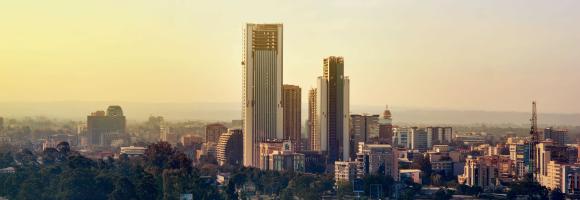
This data represents the total built-up volume between 1975 and 2030 in 5 year intervals over cells of 1x1 km size.
It derives from the GHS-BUILT-V - R2023A spatial raster dataset, that depicts the distribution of built-up volumes, expressed as number of cubic metres. The data report about the total built-up volume and the built-up volume allocated to dominant non-residential (NRES) uses.
The dataset is part the Global Human Settlement Layer , Global, high-resolution, multi-temporal gridded data on built-up environment (built-up surface, built-up volume, residential vs. non-residential function), resident population, and settlement classification by the UN-recommended methodology “degree of urbanisation”. The complete information about the GHSL main products can be found in the GHSL Data Package 2023 report
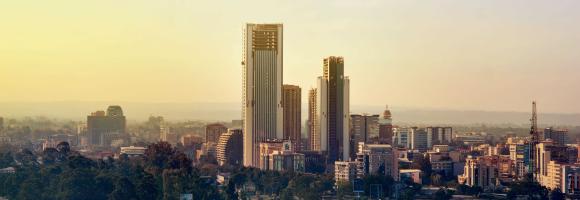
This data represents the distribution of human population between 1975 and 2030 in 5 year intervals over cells of 1x1 km size.
It derives from the GHS-POP - R2023A. Residential population estimates between 1975 and 2020 in 5-year intervals and projections to 2025 and 2030 derived from CIESIN GPWv4.11 were disaggregated from census or administrative units to grid cells, informed by the distribution, volume, and classification of built-up as mapped in the Global Human Settlement Layer (GHSL) global layer per corresponding epoch.
The dataset is part the Global Human Settlement Layer, that provide global, high-resolution, multi-temporal gridded data on built-up environment (built-up surface, built-up volume, residential vs. non-residential function), resident population, and settlement classification by the UN-recommended methodology “degree of urbanisation”. The complete information about the GHSL main products can be found in the GHSL Data Package 2023 report.
In 2020, a group of researchers carried out analysis to examine the importance of Indigenous Peoples’ lands for preserving Intact Forest Landscapes.(Fa et al.2020)They used geospatial data on the extent of Indigenous Peoples’ lands reported by Garnett et al. (2018), and Geospatial data for IFLs were sourced from the Intact Forest Landscapes website (www.intactforests.org) for the years 2000, 2013, and 2016 (Potapov et al. 2017)In the paper they have shown that the proportion of Indigenous Peoples’ lands mapped as IFLs was considerably higher (10.9%) than the proportion of other lands (defined here as all land outside Indigenous Peoples’ lands) mapped as IFLs (6.8%).
In this map we reported the percentage of Intact Forest Lansdcapes reduction in Indigenous People Lands for the period 2000-2016. IN the table we reported also the percentage of IFLs reduction in other lands. To explore more IFLs conservation strategies for African, Caribbean and Pacific countries you can check BIOPAMA Geonode Layers
Sources:
Fa JE, Watson JE, Leiper I, Potapov P, Evans TD, Burgess ND, Molnár Z, Fernández‐Llamazares Á, Duncan T, Wang S, Austin BJ. Importance of Indigenous Peoples’ lands for the conservation of Intact Forest Landscapes. Frontiers in Ecology and the Environment. 2020 Apr;18(3):135-4
From the new available dataset in GFW on tree cover change between 2000 and 2020, here we are displaying the net change in tree cover by percent for country.The net change in tree cover corresponds to the area of gross gain minus the area of gross loss to show the overall change (negative or positive). The attribute table provides also statistics on net change in tree cover such stable forest or disturbed forest(in hectars).
This dataset is accessed through Global Forest Watch on 04/10/2022. www.globalforestwatch.org.
Potapov, P., Hansen, M.C., Pickens, A., Hernandez-Serna, A., Tyukavina, A., Turubanova, S., Zalles, V., Li, X., Khan, A., Stolle, F., Harris, N., Song, X-P., Baggett, A., Kommareddy, I., and Kommareddy, A. 2022. The Global 2000-2020 Land Cover and Land Use Change Dataset Derived From the Landsat Archive: First Results. Frontiers in Remote Sensing, 13, April 2022. https://doi.org/10.3389/frsen.2022.856903; summarized by administrative area at WRI


This dataset shows the African power plants by energy generation type. It includes thermal plants (coal, gas, oil, nuclear, biomass, waste, geothermal) and renewables (hydro, wind, solar). Each power plant is geolocated and entries contain information on plant capacity and generation type.
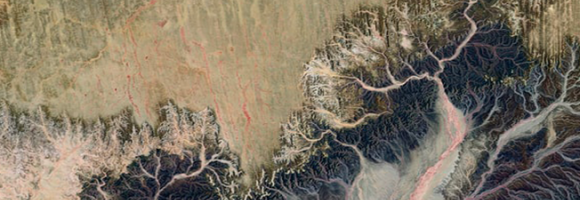
This map provides a spatially explicit characterization of 47 terrestrial habitat types, as defined in the International Union for Conservation of Nature (IUCN) habitat classification scheme, which is widely used in ecological analyses, including for quantifying species’ Area of Habitat. The map broadens our understanding of habitats globally, assist in constructing area of habitat refinements, and are relevant for broad-scale ecological studies and future IUCN Red List assessments. Periodic updates are planned as better or more recent data becomes available.
This map provides a spatially explicit characterization of 47 terrestrial habitat types, as defined in the International Union for Conservation of Nature (IUCN) habitat classification scheme, which is widely used in ecological analyses, including for quantifying species’ Area of Habitat. The map broadens our understanding of habitats globally, assist in constructing area of habitat refinements, and are relevant for broad-scale ecological studies and future IUCN Red List assessments. Periodic updates are planned as better or more recent data becomes available.
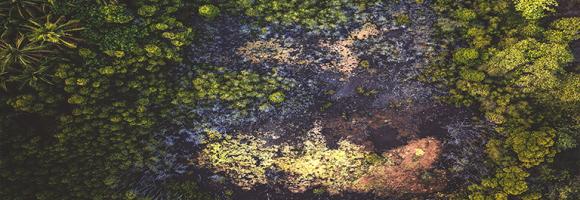
Tropical moist forests have a huge environmental value. They play an important role in biodiversity conservation, terrestrial carbon cycle, hydrological regimes, indigenous population subsistence and human health (1-5). They are increasingly recognized as an essential element of any strategy to mitigate climate change. Deforestation, and degradation compromise the functioning of tropical forests as an ecosystem, lead to biodiversity loss and reduced carbon storage capacity. Deforestation and fragmentation are increasing the risk of virus disease outbreaks. This map shows where deforestation occurred in the last three decades (between 1982 and 2020) and the year when the forest cover has been deforested for the first time (followed or not by a regrowth).
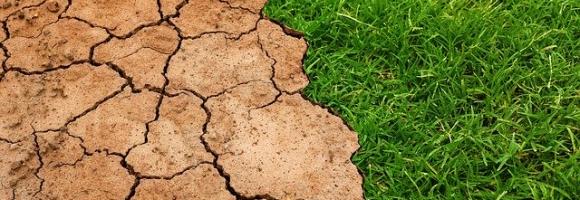
Tropical moist forests have a huge environmental value. They play an important role in biodiversity conservation, terrestrial carbon cycle, hydrological regimes, indigenous population subsistence and human health (1-5). They are increasingly recognized as an essential element of any strategy to mitigate climate change. Deforestation, and degradation compromise the functioning of tropical forests as an ecosystem, lead to biodiversity loss and reduced carbon storage capacity. Deforestation and fragmentation are increasing the risk of virus disease outbreaks. This map shows where degradation occurred in the last three decades (between 1982 and 2020) and the year when the forest has been degraded for the first time (and remained degraded up to 2020).
Tropical moist forests have a huge environmental value. They play an important role in biodiversity conservation, terrestrial carbon cycle, hydrological regimes, indigenous population subsistence and human health (1-5). They are increasingly recognized as an essential element of any strategy to mitigate climate change. Accurate characterization of the tropical moist forests changes is needed to support conservation policies and to better quantify their contribution to global carbon fluxes. The transition map captures the dynamics of changes in tropical moist forests between the initial observation period (1990) and the end of the year 2020.
This data represents the total built-up volume between 1975 and 2030 in 5 year intervals over cells of 1x1 km size.
It derives from the GHS-BUILT-V - R2023A spatial raster dataset, that depicts the distribution of built-up volumes, expressed as number of cubic metres. The data report about the total built-up volume and the built-up volume allocated to dominant non-residential (NRES) uses.
The dataset is part the Global Human Settlement Layer , Global, high-resolution, multi-temporal gridded data on built-up environment (built-up surface, built-up volume, residential vs. non-residential function), resident population, and settlement classification by the UN-recommended methodology “degree of urbanisation”. The complete information about the GHSL main products can be found in the GHSL Data Package 2023 report
This data represents the distribution of human population between 1975 and 2030 in 5 year intervals over cells of 1x1 km size.
It derives from the GHS-POP - R2023A. Residential population estimates between 1975 and 2020 in 5-year intervals and projections to 2025 and 2030 derived from CIESIN GPWv4.11 were disaggregated from census or administrative units to grid cells, informed by the distribution, volume, and classification of built-up as mapped in the Global Human Settlement Layer (GHSL) global layer per corresponding epoch.
The dataset is part the Global Human Settlement Layer, that provide global, high-resolution, multi-temporal gridded data on built-up environment (built-up surface, built-up volume, residential vs. non-residential function), resident population, and settlement classification by the UN-recommended methodology “degree of urbanisation”. The complete information about the GHSL main products can be found in the GHSL Data Package 2023 report.
This data represents the distribution of human population between 1975 and 2030 in 5 year intervals over cells of 100x100 m size.
It derives from the GHS-POP - R2023A. Residential population estimates between 1975 and 2020 in 5-year intervals and projections to 2025 and 2030 derived from CIESIN GPWv4.11 were disaggregated from census or administrative units to grid cells, informed by the distribution, volume, and classification of built-up as mapped in the Global Human Settlement Layer (GHSL) global layer per corresponding epoch.
The dataset is part the Global Human Settlement Layer, that provide global, high-resolution, multi-temporal gridded data on built-up environment (built-up surface, built-up volume, residential vs. non-residential function), resident population, and settlement classification by the UN-recommended methodology “degree of urbanisation”. The complete information about the GHSL main products can be found in the GHSL Data Package 2023 report.
These layers present the application of the Degree of Urbanisation stage I methodology recommended by UN Statistical Commission to the global population grid generated by the JRC in the epochs 1975-2030 (5 years timestep).
They derive from the GHS-SMOD - R2023A.
The layers have been generated by integration of built-up surface extracted from Landsat and Sentinel-2 image data processing (GHS-BUILT-S R2023), and population data derived from the CIESIN GPW v4.11 (GHS-POP R2023).
The dataset is part the Global Human Settlement Layer, that provide global, high-resolution, multi-temporal gridded data on built-up environment (built-up surface, built-up volume, residential vs. non-residential function), resident population, and settlement classification by the UN-recommended methodology “degree of urbanisation”. The complete information about the GHSL main products can be found in the GHSL Data Package 2023 report.
Forests worldwide are in a state of flux, with accelerating losses in some regions and gains in others. Given the recognized importance of forest ecosystem services, quantification of global forest extent and change is needed. This map displays the tree cover in the year 2000. Tree cover is defined as canopy closure for all vegetation taller than 5m in height and is expressed as a percentage per output grid cell, in the range 0–100.
Forests worldwide are in a state of flux, with accelerating losses in some regions and gains in others. Given the recognized importance of forest ecosystem services, quantification of global forest extent and change is needed. This map displays the forest gain during the period 2000–2018. Forest gain is defined as the inverse of loss, or a change from non-forest to forest entirely within the study period. It is expressed as either 1 (gain) or 0 (no gain).
Forests worldwide are in a state of flux, with accelerating losses in some regions and gains in others. Given the recognized importance of forest ecosystem services, quantification of global forest extent and change is needed. This map displays the forest loss during the period 2000–2018, defined as a stand-replacement disturbance, or a change from forest to non-forest state. It is expressed as either 1 (loss - in red) or 0 (no loss).