Food crisis response planning can save lives if put in place in a timely manner. To do this, decision makers must be warned of climate extreme events impacting agricultural production. The Anomaly hotSpot of Agricultural Production tool (ASAP) is an online decision support system for early warning about hotspots of agricultural production anomaly (crop and rangeland), developed by the JRC for food security crises prevention and response planning anticipation. This map shows the frequency of ASAP anomaly warnings for crop growth for 2004-2018. It highlights the high sensitivity of the main agricultural areas in Northern Africa, the Horn of Africa and the Southern African Development Community to drought conditions.
Food crisis response planning can save lives if put in place in a timely manner. To do this, decision makers must be warned of climate extreme events impacting agricultural production. The Anomaly hotSpot of Agricultural Production tool (ASAP) is an online decision support system for early warning about hotspots of agricultural production anomaly (crop and rangeland), developed by the JRC for food security crises prevention and response planning anticipation. This map shows the frequency of ASAP anomaly warnings for rangeland growth for 2004-2018. It highlights the high sensitivity of the main agricultural areas in Northern Africa, the Horn of Africa and the Southern African Development Community to drought conditions.
Food crisis response planning can save lives if put in place in a timely manner. To do this, decision makers must be warned of climate extreme events impacting agricultural production. The Anomaly hotSpot of Agricultural Production tool (ASAP) is an online decision support system for early warning about hotspots of agricultural production anomaly (crop and rangeland), developed by the JRC for food security crises prevention and response planning anticipation. This map shows the frequency at which countries were classified as hotspots for agricultural production problems between 2004 and 2018. Hotspots are identified on a monthly basis.
The Shannon index gives an understanding of crop diversity. It takes into account both the number of different crop types and their relative abundance.
Earth magnetic anomaly grid derived from ship, airbone and satalite data, part of the EMAG2 V3 model.
Values are expressed in nT.
This dataset is part of the LEAP-RE project collection. For more information visit https://www.leap-re.eu/
This layer presents the Effective Leaf Area Index (LAIe) Anomalies, representing the deviation of current vegetation density from the historical average. Monitoring the change of LAI is essential for assessing the evolution of the vegetation over Africa.
LAI anomalies are calculated relative to the average values between 2003 and 2010. The dataset captures LAI anomalies every 10 days, reflecting the high variability and rapid changes in African vegetation cover.
Increases in temperature and precipitation deficits are the primary drivers for negative anomalies (reduced foliage density).
Beyond climatic factors, human activities or animal grazing may also locally impact the state and density of leaves.
This layer is part of the a href="https://fapar.jrc.ec.europa.eu/_www/index.php">Earth Land Information System (ELIS).
The Fraction of Photosynthetically Active Radiation Absorbed (FAPAR) is used to track the overall primary productivity associated with atmospheric CO2 fixation. FAPAR anomalies relative to the average between 2003 and 2010 show large surface variations, in terms of values and coverage, of vegetation productivity conditions over Africa. Temperature and precipitation deficits are the main drivers for the negative anomalies. Each location with a negative anomaly (FAPAR value lower than the long-term mean for that location – shades of red) indicates relative vegetation stress during that 10-day interval. Each location with a positive anomaly (FAPAR value higher than long-term mean for that location – shades of green) indicates relative favourable vegetation growth conditions during that 10-day interval. FAPAR values and their anomalies provide useful information for water and agricultural management purposes.
Monitoring of sea surface temperature (SST) provides fundamental information on the global climate system and for the study of marine ecosystems. This layer compares the SST value of the last full month with the long-term mean SST. A positive anomaly (warm colours) means the monthly SST is warmer than the long-term average for that month; a negative anomaly (cool colours) means it is cooler than the average.
Monitoring of sea surface temperature (SST) provides fundamental information on the global climate system and for the study of marine ecosystems. For example, it helps estimating heat stress conducive to coral bleaching, the process by which they expel the symbiotic algae living in their tissues and become white (bleached) and vulnerable. The NOAA Coral Reef Watch's daily global 5km satellite SST Anomaly (SSTA) compares the daily SST value with the long-term mean SST. A positive anomaly (+1.0 °C or more, warm colours) means the daily SST is warmer than the long-term average for that day; a negative anomaly (-1.0 °C or less, cold colours) means it is cooler than the average.
Agricultural drought events can affect large regions across the world. Soil moisture (or soil water content) is an important variable for plant growth, and - together with precipitation and evapotranspiration - is a basic component of the hydrological cycle. The Soil Moisture Anomaly (SMA) indicator is used to detect and monitor agricultural drought, that is when there is reduced crop production due to insufficient soil moisture. It is computed as a deviation from the climatological reference period, and is updated 3 times a month (after the 10th, the 20th and the last day of the month). This layer displays the map for the last full decade of the current month. Negative anomalies (shades of brown) represent dry conditions.
Magnetic anomaly map of Africa, derived from the World Digital Magnetic Anomaly map (WDMAM). Note that the blurry areas are interpolated due to source not containing data points.
Values are expressed in nT.
The WDMAM is an international scientific project under the auspices of IAGA (International Association of Geomagnetism and Aeronomy) and CGMW (Commission for the Geological Map of the World), aiming to compile and make available magnetic anomalies caused by the Earth lithosphere, on continental and oceanic areas, in a comprehensive way, all over the World.
This layer is part of the
Geothermal Atlas for Africa developed within the LEAP-RE project"
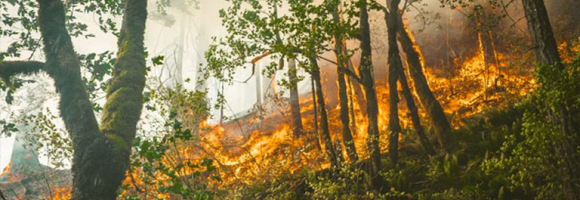
Vegetation fires have become a major concern in Africa because of their negative impacts on the environment and on human welfare. Uncontrolled (and un-prescribed) wildfires cause forest and vegetation degradation and related biodiversity loss, resulting in immediate and long-term impacts on the livelihoods of local communities and upstream impacts on national and regional economies. Fires in the tropical environment are a major contributor to tropical forest degradation and, if too frequent, can lead to savannisation of these areas. Vegetation fires are also a significant source of trace gases and aerosols in the atmosphere and contribute to the anticipated climate change, particularly with emissions of CO2. This layer shows the deviation of dekadal fire occurrences from the long-term average of the same 10-day period. A positive anomaly means more fire events than average for the last full 10-day period (red). A negative anomaly means less fire events than average for the last full 10-day period (green).
Crop conditions monitoring is highly relevant for food security early warning and response planning in food-insecure areas of the world. GEOGLAM (the Group on Earth Observations' Global Agricultural Monitoring Initiative) aims to reinforce the international community's capacity to produce and disseminate relevant, timely, and accurate forecasts of agricultural production at national, regional, and global scales using Earth Observation data.
Copernicus4GEOGLAM, one of the Copernicus Land Monitoring Services managed by the EC Joint Research Centre, aims to produce baseline information that allows countries in Africa to improve their agricultural monitoring systems.
This dataset aggregates crop maps requested by three East African nations, showing the agricultural situation at the end of the long rain season of 2021. The results are made fully and freely accessible, covering the following areas:
Water Footprint in Africa, considered as the sum of both the green and blue WF and defined as the ratio between evapotranspiration (in m3 per hectare) and crop yield (in ton per hectare). The values are expressed in m3/ton.
Chlorophyll-a concentrations (Chla) are an indicator of phytoplankton abundance and biomass in open waters. They can be an effective measure of trophic status and are commonly used to measure water quality. This layer compares the Chla value from the last full month with the long-term mean Chla. A positive anomaly (warm colours) means the monthly Chla is higher than the long-term average for that month; a negative anomaly (cool colours) means it is lower than the average.
Increasing water scarcity and water quality issues are serious constraints in Africa and worldwide. Measuring precipitation anomalies is important for detecting and characterizing meteorological droughts, and, in the agricultural sector especially, for effectively managing climate related uncertainties. This layer shows the deviation of the precipitations of the last full month from the long-term average of the same month. A positive anomaly (shades of blue) means there was more rainfall than average during that month. A negative anomaly (yellow to red) means there was less rainfall than average during that month.