Main navigation
User account menu
Language
This dataset provides projections of global rainfall erosivity changes, a critical metric representing the erosive force of rainfall that drives worldwide soil and nutrient loss. These maps serve as essential inputs for global and regional soil erosion assessment models. The collection details the geographical distribution of projected erosivity changes across two primary periods: 2010–2050 and 2050–2070. To account for different climate trajectories, the dataset includes models for three distinct Representative Concentration Pathway (RCP) scenarios for both timeframes: RCP 2.6 (stringent mitigation), RCP 4.5 (intermediate emissions), and RCP 8.5 (high emissions). By combining these temporal and climatic variables, users can evaluate and compare potential future soil erosion risks under varying degrees of global climate change.
African countries have an evident potential for solar energy. Knowing what amount of solar radiation reaches the earth's surface is of particular interest for solar photovoltaic (PV) installations. It can be represented by the average annual potential energy production (or yield): the total amount of electricity (kWh) produced in one year by a 1 kWp PV system at optimal angle, expressed in kWh/kWp.
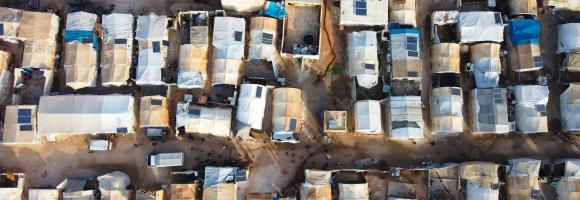
Some extraordinary changes have occurred across the globe over the past decades regarding human habitation. Globally, between 1975 and 2015 built-up areas increased by approximately 250 %, while population increased by a factor of 1.8. The most considerable changes occurred in Africa where it has nearly quadrupled. The extent of built-up area poses a number of challenges to global sustainable development. As urban clusters expand, productive land and soil is sealed, and natural ecosystems are replaced by land use to support urban centres. This layer highlights the areas of concern for built-up related issues derived from the convergence of global evidence of human-environment interactions that can have land degradation consequences.
The data provided here are the result of a time-series analysis of carbon density change (in Mg/ha) between 2003-2014 spanning tropical America, Africa, and Asia (23.45 N lat.-23.45 S lat.). The original data is provided as two separate rasters representing (1) carbon density net gain and (2) carbon density net loss within each ~463 x 463 metre pixel, with only pixels exhibiting statistical significance at the 95% level being reported. The data here was re-projected from the its original MODIS sinusoidal projection to WGS84.
During the last twenty years (2000-2020) the intact forest landscapes extent within African, Caribbean and Pacific countries, decreased by 16% (237275km2).
However the protection of IFLs increased in the last two decades. Since 2000, around 100 conserved and protected areas were created in intact forests areas in ACP countries, increasing the percentage of IFL protected from 11% in 2000 to 26% in 2020.. Ethiopia has proposed six protected areas that will cover the total extent of IFL in the country. Republic of Congo increased IFL protection from 15,78% in 2000 to 67,07% in 2020.
| Country | Percentage protected in 2000 | Percentage protected in 2013 | Percentage protected in 2016 | Percentage protected in 2020 |
| Angola | 0.00 | 0.00 | 0 | 0.00 |
| Belize | 90.63 | 92.14 | 91.44447 | 91.99 |
| Cote d'Ivoire | 45.76 | 68.62 | 70.72509 | 82.37 |
| Cameroon | 98.89 | 99.96 | 99.96414 | 99.97 |
| Central African Republic | 14.20 | 39.23 | 47.47338 | 60.00 |
| Congo | 12.65 | 19.72 | 21.21028 | 22.03 |
| Cuba | 15.78 | 59.62 | 63.48035 | 67.07 |
| Democratic Republic of the Congo | 0.00 | 100.00 | 100 | 100.00 |
| Dominican Republic | 0.00 | 98.05 | 98.04902 | 98.05 |
| Equatorial Guinea | 1.07 | 0.00 | 0 | 0.00 |
| Ethiopia | 5.23 | 27.32 | 28.38109 | 29.74 |
| Gabon | 36.57 | 66.72 | 72.62826 | 73.61 |
| Guyana | 2.89 | 12.50 | 12.99736 | 13.25 |
| Liberia | 29.30 | 43.19 | 43.42341 | 54.63 |
| Madagascar | 34.84 | 39.28 | 37.74979 | 91.96 |
| Nigeria | 88.66 | 89.20 | 89.64465 | 91.54 |
| Papua New Guinea | 2.36 | 3.50 | 3.627328 | 4.61 |
| Samoa | 0.00 | 0.00 | 0 | 2.29 |
| Solomon Islands | 11.64 | 16.82 | 17.09852 | 18.69 |
| Suriname | 83.56 | 86.31 | 85.87311 | 95.55 |
| Uganda | 96.84 | 97.64 | 97.85507 | 98.25 |
| United Republic of Tanzania | 2.02 | 1.91 | 1.906882 | 1.92 |
| Vanuatu | 0.00 | 14.54 | 14.54262 | 14.48 |
Analysis performed by Simona Lippi
Reference:
Potapov, P., Hansen, M. C., Laestadius L., Turubanova S., Yaroshenko A., Thies C., Smith W.,
Zhuravleva I., Komarova A., Minnemeyer S., Esipova E. “The last frontiers of wilderness: Tracking loss of
intact forest landscapes from 2000 to 2013” Science Advances, 2017; 3:e1600821
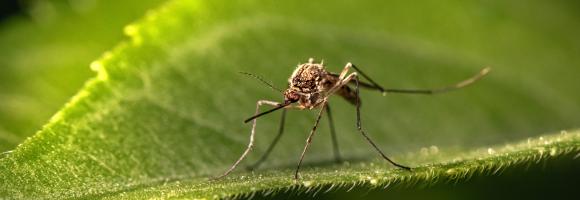
Malaria, a life-threatening disease transmitted by mosquitoes, affects millions of people worldwide. Treatment and prevention efforts such as insecticide-treated mosquito nets and rapid diagnostic tests significantly decreased the number of malaria cases in Africa. This layer displays the change in malaria rates (%) from 2000 to 2015 among children in Sub-Saharan Africa.
''Intact Forest Landscapes (IFLs) are defined as those with an unfragmented area of at least 500 km2 and which are minimally influenced by human economic activity''.(Thies et al. 2011) IFLs are critical for stabilizing terrestrial carbon storage, harboring biodiversity, regulating hydrological regimes, and providing other ecosystem functions. Researchers, firstly, created a global IFL map using existing fine-scale maps and
a global coverage of high spatial resolution satellite imagery (Potapov et al. 2008). Moreover they assessed the distribution and dynamics of IFLs within the extent of present-day forest ecosystems tracking loss of intact forest landscapes from 2000 to 2020. In this layer we show the reduction of the IFL extent for African, Caribbean and Pacific (ACP)countries that decreased by 16,6% since the year 2000. Countries that experienced the largest reduction in intact forest landscape area over the past two decades are Solomon Islands with 66,3 %, Central African Republic with 57% and Equatorial Guinea with 50,4%. Democratic Republic of the Congo still has the highest proportion of intactness of ACP countries with 59,7Mha. IFL in Democratic Republic of the Congo has an extent of 64,3Mha as the 27,7% of its forest cover.
| Country | IFL Area in 2000 (sqkm) | IFL Area in 2020 (sqkm) | Percentage of IFL reduction |
| Angola | 2913.32 | 1752.85 | 39.83 |
| Belize | 4275.28 | 3598.44 | 15.83 |
| Cote d'Ivoire | 4558.78 | 3760.48 | 17.51 |
| Cameroon | 52752.96 | 31968.77 | 39.40 |
| Central African Republic | 8695.96 | 3727.14 | 57.14 |
| Congo | 138699.28 | 100215.44 | 27.75 |
| Cuba | 544.02 | 544.02 | 0.00 |
| Democratic Republic of the Congo | 643864.37 | 597275.75 | 7.24 |
| Dominican Republic | 795.21 | 564.89 | 28.96 |
| Equatorial Guinea | 4249.57 | 2104.83 | 50.47 |
| Ethiopia | 3671.63 | 3233.76 | 11.93 |
| Gabon | 108838.30 | 76291.78 | 29.90 |
| Guyana | 144296.97 | 117327.95 | 18.69 |
| Liberia | 4748.74 | 2880.65 | 39.34 |
| Madagascar | 17240.16 | 10799.08 | 37.36 |
| Nigeria | 2959.07 | 2416.10 | 18.35 |
| Papua New Guinea | 159523.52 | 127121.71 | 20.31 |
| Samoa | 650.86 | 643.16 | 1.18 |
| Solomon Islands | 7820.33 | 2630.05 | 66.37 |
| Suriname | 107282.59 | 92574.26 | 13.71 |
| Uganda | 984.66 | 962.06 | 2.30 |
| United Republic of Tanzania | 4081.92 | 3796.32 | 7.00 |
| Vanuatu | 706.13 | 688.33 | 2.52 |
At any given place on Earth, complex human-environment interactions are at play. They include differing rates and magnitudes of drivers (e.g. overgrazing, climate change, agricultural practices) and differing consequences in land degradation (e.g. soil erosion, changes in productivity, loss of biodiversity). The occurrence of multiple global change issues at a location suggests a potential for land degradation, at least in some form. This layer depicts where global change issues relevant to land degradation coincide at a global scale. It helps identifying local or regional areas of concern where land degradation processes may be underway.
Park managers in many countries across Africa need to monitor and understand their parks features and overall health. They can rely on the highly detailed land cover information offered by the Copernicus Hot Spot Land Cover Change Explorer for specific areas of interest –or hot spots. These areas were selected for their importance in biodiversity preservation (Protected Areas, Key Landscapes for Conservation...). For each land cover class (Natural vegetation, Wetlands, urbane areas, etc.), this layer shows which portions of the areas changed to another class over the period (2000-2019). For a more detailed analysis, compare the layer with the present landcover or refer to the online Explorer. The allows to monitor land cover and land cover change in high detail and make informed decisions based on spatial data.
This layer maps the distribution of diverse geothermal play types categorized by:
Location: Precise spatial boundaries of geothermal provinces.
Geodynamic Setting: Classification by tectonic regime.
Play Type: Categorization based on heat source and fluid transport mechanisms.
Energy Application: Indication of suitability for power production or direct-use applications.
This dataset provides the P50 projections for a geothermal system utilizing a Chiller unit.
Chiller refers to an absorption chiller or heat pump integrated into the geothermal system. It is used to provide cooling (by utilizing the geothermal heat) or to extract additional heat from the return fluid, thereby increasing the system's overall thermal harvest.
P50 is a statistical term used in risk analysis and forecasting. P50 represents the median scenario, meaning there is a 50% probability that the actual outcome will be higher than this value and a 50% probability it will be lower. It serves as the baseline "best estimate."
Metrics DefinitionsCoefficient of Performance (COP) [-]: A measure of efficiency, defined as the ratio of useful heating or cooling provided to the work (energy) required to operate the Chiller. Higher values indicate greater efficiency.
Doublet Net Production [MW]: The actual useful power output (Megawatts) generated by the "doublet" (one production well + one injection well), subtracting any energy used by pumps or auxiliary equipment.
Levelized Cost of Energy (LCOE) [US$ct/kWh]: The average revenue per unit of energy needed to recover the cost of building and operating the plant over its entire life cycle. It essentially represents the break-even price.
Net Present Value (NPV) [million US$]: The current financial value of all future cash flows the project will generate, minus the initial investment costs. A positive NPV generally indicates a profitable project.
Optimized Depth of the Aquifer [m]: The calculated ideal drilling depth (meters) to reach the geothermal reservoir that balances drilling costs with temperature/flow benefits.
Production Flow Rate [m³/h]: The volume of geothermal fluid extracted from the reservoir per hour (cubic meters per hour).
Temperature at Reservoir [°C]: The natural temperature (Celsius) of the geothermal fluid within the subsurface rock formation before it is brought to the surface.
Transmissivity [Dm]: A measure of how easily fluid flows through the porous aquifer. It is the product of hydraulic conductivity and aquifer thickness (often measured in Darcy-meters). High transmissivity means easier extraction.
Well Distance [m]: The physical distance (meters) between the production well (extraction) and the injection well (return). Proper spacing prevents "short-circuiting," where cool injected water lowers the temperature of the production well too quickly.
This dataset provides the P50 projections for a Direct Heat geothermal system.
Direct Heat refers to the use of geothermal energy for applications such as space heating, industrial processes, or agriculture. In the utilized model, it is assumed a minimum production temperature of at least 60°C and a reinjection temperature of 40°C.
P50 is a statistical term used in risk analysis and forecasting. P50 represents the median scenario, meaning there is a 50% probability that the actual outcome will be higher than this value and a 50% probability it will be lower. It serves as the baseline "best estimate."
Metrics DefinitionsCoefficient of Performance (COP) [-]: A measure of efficiency, defined as the ratio of useful heating or cooling provided to the work (energy) required to operate the Chiller. Higher values indicate greater efficiency.
Doublet Net Production [MW]: The actual useful power output (Megawatts) generated by the ""doublet"" (one production well + one injection well), subtracting any energy used by pumps or auxiliary equipment.
Levelized Cost of Energy (LCOE) [US$ct/kWh]: The average revenue per unit of energy needed to recover the cost of building and operating the plant over its entire life cycle. It essentially represents the break-even price.
Net Present Value (NPV) [million US$]: The current financial value of all future cash flows the project will generate, minus the initial investment costs. A positive NPV generally indicates a profitable project.
Optimized Depth of the Aquifer [m]: The calculated ideal drilling depth (meters) to reach the geothermal reservoir that balances drilling costs with temperature/flow benefits.
Production Flow Rate [m³/h]: The volume of geothermal fluid extracted from the reservoir per hour (cubic meters per hour).
Temperature at Reservoir [°C]: The natural temperature (Celsius) of the geothermal fluid within the subsurface rock formation before it is brought to the surface.
Transmissivity [Dm]: A measure of how easily fluid flows through the porous aquifer. It is the product of hydraulic conductivity and aquifer thickness (often measured in Darcy-meters). High transmissivity means easier extraction.
Well Distance [m]: The physical distance (meters) between the production well (extraction) and the injection well (return). Proper spacing prevents ""short-circuiting,"" where cool injected water lowers the temperature of the production well too quickly.
This dataset provides the P50 projections for a Direct Heat with Heat Pump geothermal system.
Direct Heat with Heat Pump refers to a scenario where a geothermal system is integrated with an industrial heat pump to upgrade low-grade heat. This allows for production from geothermal temperatures as low as 40°C, which are then heated by the pump to a delivery temperature of 80°C. The reinjection temperature is set to the production temperature minus 20°C, with a absolute minimum of 15°C.
P50 is a statistical term used in risk analysis and forecasting. P50 represents the median scenario, meaning there is a 50% probability that the actual outcome will be higher than this value and a 50% probability it will be lower. It serves as the baseline ""best estimate.""
Metrics DefinitionsCoefficient of Performance (COP) [-]: A measure of efficiency, defined as the ratio of useful heating or cooling provided to the work (energy) required to operate the Chiller. Higher values indicate greater efficiency.
Doublet Net Production [MW]: The actual useful power output (Megawatts) generated by the ""doublet"" (one production well + one injection well), subtracting any energy used by pumps or auxiliary equipment.
Levelized Cost of Energy (LCOE) [US$ct/kWh]: The average revenue per unit of energy needed to recover the cost of building and operating the plant over its entire life cycle. It essentially represents the break-even price.
Net Present Value (NPV) [million US$]: The current financial value of all future cash flows the project will generate, minus the initial investment costs. A positive NPV generally indicates a profitable project.
Optimized Depth of the Aquifer [m]: The calculated ideal drilling depth (meters) to reach the geothermal reservoir that balances drilling costs with temperature/flow benefits.
Production Flow Rate [m³/h]: The volume of geothermal fluid extracted from the reservoir per hour (cubic meters per hour).
Temperature at Reservoir [°C]: The natural temperature (Celsius) of the geothermal fluid within the subsurface rock formation before it is brought to the surface.
Transmissivity [Dm]: A measure of how easily fluid flows through the porous aquifer. It is the product of hydraulic conductivity and aquifer thickness (often measured in Darcy-meters). High transmissivity means easier extraction.
Well Distance [m]: The physical distance (meters) between the production well (extraction) and the injection well (return). Proper spacing prevents ""short-circuiting,"" where cool injected water lowers the temperature of the production well too quickly.
This dataset provides the P50 projections for an Organic Rankine Cycle (ORC) geothermal power plant.
Organic Rankine Cycle (ORC) refers to a binary power plant configuration where geothermal fluid (brine) is used to heat a secondary organic working fluid. This process allows for efficient electricity generation from medium-to-low temperature resources (typically 90°C to 150°C). The organic fluid vaporizes, drives a turbine, and is then condensed back into a liquid to repeat the cycle. The geothermal brine is reinjected into the reservoir after passing through the heat exchanger.
P50 is a statistical term used in risk analysis and forecasting. P50 represents the median scenario, meaning there is a 50% probability that the actual outcome will be higher than this value and a 50% probability it will be lower. It serves as the baseline ""best estimate.""
Metrics DefinitionsCoefficient of Performance (COP) [-]: A measure of efficiency, defined as the ratio of useful heating or cooling provided to the work (energy) required to operate the Chiller. Higher values indicate greater efficiency.
Doublet Net Production [MW]: The actual useful power output (Megawatts) generated by the ""doublet"" (one production well + one injection well), subtracting any energy used by pumps or auxiliary equipment.
Levelized Cost of Energy (LCOE) [US$ct/kWh]: The average revenue per unit of energy needed to recover the cost of building and operating the plant over its entire life cycle. It essentially represents the break-even price.
Net Present Value (NPV) [million US$]: The current financial value of all future cash flows the project will generate, minus the initial investment costs. A positive NPV generally indicates a profitable project.
Optimized Depth of the Aquifer [m]: The calculated ideal drilling depth (meters) to reach the geothermal reservoir that balances drilling costs with temperature/flow benefits.
Production Flow Rate [m³/h]: The volume of geothermal fluid extracted from the reservoir per hour (cubic meters per hour).
Temperature at Reservoir [°C]: The natural temperature (Celsius) of the geothermal fluid within the subsurface rock formation before it is brought to the surface.
Transmissivity [Dm]: A measure of how easily fluid flows through the porous aquifer. It is the product of hydraulic conductivity and aquifer thickness (often measured in Darcy-meters). High transmissivity means easier extraction.
Well Distance [m]: The physical distance (meters) between the production well (extraction) and the injection well (return). Proper spacing prevents ""short-circuiting,"" where cool injected water lowers the temperature of the production well too quickly.
Many African countries, especially in the Sub-Saharan region highly depend on hydropower which is one of the energy sources that are most affected by droughts. At the same time hydropower has a huge impact on water consumption (mainly through evaporation from reservoir surfaces) in comparison with other fuel types despite having higher densities of plants and installed capacities. Hydropower accounts for 15% of Africa’s energy production. This map shows the energy production (GWh) of hydropower plants with an installed capacity above 5MW, aggregated for each hydropower-generating country in Africa for year 2016.
The hydropower installed capacity indicates the amount of energy a hydropower plant can produce in its turbines. In 2016, hydropower accounted for 54% of the installed capacity in Eastern Africa, 58% in Central Africa and 30% in Western Africa with fourteen countries having a hydropower share above 50% and eight countries above 70%. These highly hydropower-dependent countries are particularly prone to electricity cuts due to the lack of water caused by severe droughts. This map shows the location and installed capacities of hydropower plants above 5MW installed capacity in Africa for year 2016, representing 95% of the total hydropower installed capacity in Africa.
Land cover is defined as the physical material at the surface of the earth, usually documented via the interpretation of earth observations. Common land cover types include trees, grass, bare ground, built up areas, water, etc. How well are different ecosystem types (as indicated by land cover) preserved and how strong are anthropogenic changes affecting their distribution in a given area? Human pressures are constantly increasing and it is important to monitor the consequences of the associated changes on the environment. This map shows the changes in land cover between 1995 and 2015.
From the new available dataset in GFW on tree cover change between 2000 and 2020, here we are displaying the net change in tree cover by percent for country.The net change in tree cover corresponds to the area of gross gain minus the area of gross loss to show the overall change (negative or positive). The attribute table provides also statistics on net change in tree cover such stable forest or disturbed forest(in hectars).
This dataset is accessed through Global Forest Watch on 04/10/2022. www.globalforestwatch.org.
Potapov, P., Hansen, M.C., Pickens, A., Hernandez-Serna, A., Tyukavina, A., Turubanova, S., Zalles, V., Li, X., Khan, A., Stolle, F., Harris, N., Song, X-P., Baggett, A., Kommareddy, I., and Kommareddy, A. 2022. The Global 2000-2020 Land Cover and Land Use Change Dataset Derived From the Landsat Archive: First Results. Frontiers in Remote Sensing, 13, April 2022. https://doi.org/10.3389/frsen.2022.856903; summarized by administrative area at WRI
The human imprint on the planet has a major impact on the functioning of the Earth system. Because the impact on the environment is closely intertwined with population dynamics, it is important to monitor and include these in the evaluation of land degradation. This layer displays the areas of concern for population change related issues derived from the convergence of global evidence of human-environment interactions that can lead to land degradation. It reflects the dynamics of increasing number of people in a certain area.
This layer is part of the World Altas of Desertification
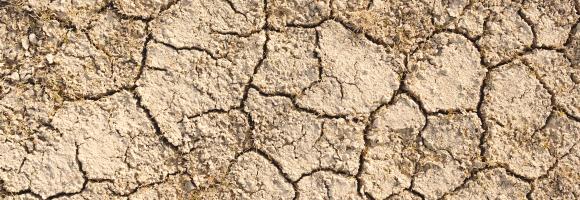
Droughts affect millions of people in the world each year and have long-lasting socioeconomic impacts. They can occur over most parts of the world, even in wet and humid regions, and can profoundly impact agriculture, basic household welfare, tourism, ecosystems and the services they provide. The Risk of Drought Impact for Agriculture (RDrI-Agri) is a categorized risk index, indicating the probability of having impacts from a drought, with particular focus on vegetation. Higher risk (in red) means that the areas affected will be the most likely to report impacts due to droughts. It is updated every ten days.
The Africa Topographic Moisture Potential layer classifies the landscape of Africa as either upland or lowland (and other depressions) area. It was produced as part of the USGS’s Africa Ecosystems Mapping project to create maps depicting standardized, terrestrial ecosystem models. Substrate moisture regimes strongly influence the differentiation and distribution of terrestrial ecosystems, and therefore topographic moisture potential is one of the key input layers in this biophysical stratification.
This dataset maps regions across Africa with high geothermal energy exploration potential, identifying areas where further research and investment are most likely to yield significant returns. The mapping represents a synthesis of the Indicator Analysis performed by TNO (Hofstra, 2023), specifically selecting the most and least favorable technical outcomes under the assumption of a clay-poor sandstone (CP) compaction model.
To ensure structural robustness and account for geological uncertainty, the indicator results have been projected onto four distinct geological basin models:
Key Indicators & Methodology
The favorable results displayed in these maps are derived from a multi-criteria evaluation which includes:
This layer is part of the Geothermal Atlas for Africa developed within the LEAP-RE project.
This dataset maps the critical structural and tectonic features across Africa that serve as key indicators for geothermal resource potential. These layers delineate "fault/fracture zones" which are considered a primary geothermal resource play type for both magmatic and non-magmatic settings.
The layers in the dataset are:
These fault layers are crucial for characterizing subsurface hydraulic properties. Specifically, the dataset's features are utilized to:
Based on the Geothermal Atlas for Africa , the temperature models at 1 km, 2 km, 3 km, and 4 km depth are part of a 3D conductive thermal model of the African lithosphere.
These layers can be described as follows:
This dataset comprises a collection of shapefiles detailing the geographical locations and attributes of various wells across Africa, with a strong focus on geothermal exploration and assessment. Together, these layers offer a valuable resource for geothermal energy planning, subsurface geological analysis, and infrastructure mapping. The collection includes the following spatial data layers:
These layers are part of the Geothermal Atlas for Africa developed within the LEAP-RE project"