Main navigation
User account menu
Language
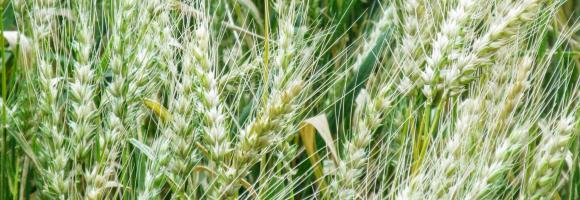
The map is based on Copernicus Global Land Cover data which shows actual land cover (what physically covers land across the globe—forests, grasslands, croplands, lakes, wetlands, built-up area, etc) at 100m x 100m resolution. The land cover data for Africa was overlaid on (high resolution) satellite imagery of Africa, which is then used to determine the land use (by visual interpretation) associated with the various land cover patterns on the Copernicus Global Land Cover map.
Copernicus land cover data offers several advantages: it is of high quality, has a high resolution (100m x 100m), and offers time series satellite imagery. More importantly, the Copernicus Global Land Service is a continuous process and its datasets are updated annually. This means that the Soils4Africa map of agricultural land can be updated every time the land cover data for the new year becomes available (the map is currently based on 2019 data).
The Copernicus dataset already includes the category ‘cropland,’ which by definition is part of agricultural land. The Soils4Africa map broadens the scope of that dataset by infering information on agricultural use and including other kinds of agricultural land use such as grazing pastures and plantations.
When land is mapped as other than ‘cropland'-- like ‘shrubland’ for example-- it is more difficult to interpret and determine whether it is under agricultural use. The Copernicus dataset includes information about ‘fractional cover’-- or the percentage of a particular pixel under a particular kind of land cover (for example, 30% of a 100m x 100m pixel could be forest and 20% could be shrubland). The Soils4Africa map takes into account how fractional cover varies over an area to establish rules for interpreting its land cover data to determine whether it is under agricultural use and for what purpose. These rules were validated by comparing it with ground level information on land use (or land use pattern) for specific areas drawn from the interpretation of satellite imagery from Google Earth.
For example, ground-level observation shows that forest cover upwards of 30% in a given area when matched by shrubland cover of over 30%, is characterized by woody vegetation with a smooth canopy. Therefore, such area is more likely to be under plantations rather than natural forest. Thus, such an area should be counted as agricultural land, even if less than 15% of it is under crops.

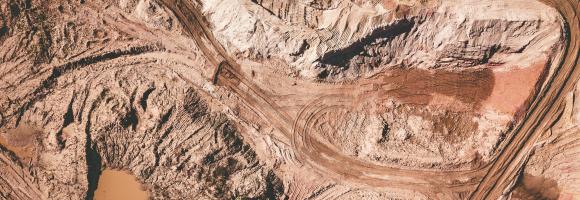
This dataset shows Regional locations and general geologic setting of known deposits of major nonfuel mineral commodities in Africa
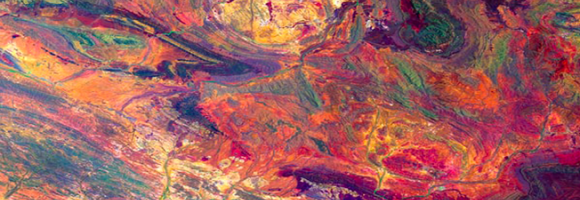
The Africa Topographic Potisiont layer classifies the African landscape (including Madagascar, Comoros Islands, and other coastal Islands near continenal Africa) into uplands and lowlands/depressions at a 100m resolution. Published by the USGS in 2009, this dataset was created for the Africa Terrestrial Ecosystems mapping project. The classification is derived from the Compound Topographic Index (CTI) , which integrates slope (from SRTM elevation data) and flow accumulation (from HydroSHEDS data) to model potential water flow.
Map showing the average continental surface temperature of the year 2022. This map was created by interpolating raw monthly satellite data to fill holes in the grids and subsequently adding and averaging the monthly surface temperatures of the year 2022. The data is clipped to only show the African continental region. The raw data is collected during the daytime by the Moderate Resolution Imaging Spectroradiometer (MODIS), an instrument on NASA's Terra and Aqua satellites. Please note that the type of "surface" MODIS measures varies as a function of location. In some places, the measurement represents the skin temperature of the bare land surface. In other places, the temperature represents the skin temperature of whatever is on the land-including snow and ice, or the leafy canopy of forests and crop fields, or human-made structures such as pavement and building rooftops.
Values are expressed in °C.
This dataset is part of the LEAP-RE project collection. For more information visit https://www.leap-re.eu/

Côte d'Ivoire and Ghana are the main largest producers of cocoa in the world. However, the cultivation of this crop has led to the loss of vast tracts of forest areas in both countries. Efficient and accurate methods for remotely identifying cocoa farms are essential for the implementation of sustainable cocoa practices and the periodic and effective monitoring of forests. This map, generated using Random Forest image classification, shows the 2019 distribution of cocoa farms in both countries. The estimated area for cocoa is 4.8Mha for Cote d'Ivoire and 2.3Mha for Ghana.

Whether you’re monitoring crops, modelling green energy installations or soil sealing, combatting loss of natural resources or just helping countries meet their Sustainable Development Goals, chances are high that you’ll need an accurate and spatially detailed map on land cover and land use. Earth Observation satellites, like those from EU’s flagship programme Copernicus, are key to providing such maps, at a global scale, with free and open access. Land cover maps represent spatial information on different types (classes) of physical coverage of the Earth's surface, e.g. forests, grasslands, croplands, lakes, wetlands. Dynamic land cover maps include transitions of land cover classes over time and hence captures land cover changes. This dataset shows the land cover for the baseline year 2019 with a discrete classification in 23 classes aligned with UN-FAO's Land Cover Classification System.
Park managers in many countries across Africa need to monitor and understand their parks features and overall health. They can rely on the highly detailed land cover information offered by the Copernicus Hot Spot Land Cover Change Explorer for specific areas of interest –or hot spots. These areas were selected for their importance in biodiversity preservation (Protected Areas, Key Landscapes for Conservation...). For each land cover class (Natural vegetation, Wetlands, urbane areas, etc.), this layer shows which portions of the areas changed to another class over the period (2000-2019). For a more detailed analysis, compare the layer with the present landcover or refer to the online Explorer. The allows to monitor land cover and land cover change in high detail and make informed decisions based on spatial data.
Copernicus is the European flagship programme for monitoring the Earth. Data is collected by Earth observation satellites and sensors on the earth’s surface. The Copernicus Land Monitoring Service provides geographical information on land use and land cover at European and global scale. Derived from the Copernicus Hot Spot Land Cover Change Explorer, this layer presents detailed land cover information for specific areas of interest –or hot spots– in Africa. These areas were selected as a priority for mapping because of their importance in biodiversity preservation (Protected Areas, Key Landscapes for Conservation...). Park managers in many countries across Africa rely on this Copernicus product to monitor and understand their parks features and overall health. Mapping habitats, assessing pressure on land, identifying prime locations for species reintroduction or new areas to protect are just a few examples of how these data can be exploited.

Humans need increasingly more biomass for food, fodder, fibre and energy. Meeting these demands changes global ecosystems. Tracking changes in total biomass production or land productivity is an essential part of monitoring land transformations that are typically associated with land degradation. Land productivity dynamics (LPD) are used as an indicator of change or stability of the land’s capacity to sustain primary production. This layer displays the areas of concern for land productivity related issues, derived from the convergence of global evidence of human-environment interactions that can have consequences on land degradation.
Food crisis response planning can save lives if put in place in a timely manner. To do this, decision makers must be warned of climate extreme events impacting agricultural production. The Anomaly hotSpot of Agricultural Production tool (ASAP) is an online decision support system for early warning about hotspots of agricultural production anomaly (crop and rangeland), developed by the JRC for food security crises prevention and response planning anticipation. This map shows the frequency at which countries were classified as hotspots for agricultural production problems between 2004 and 2018. Hotspots are identified on a monthly basis.
The application of fertiliser is a key component in increasing agricultural production. However, there are thresholds beyond which the cost of inputs fails to lead to corresponding increases in yield. Beyond economic inefficiency, overuse of commercial inorganic fertiliser can also result in a decline in soil condition and structure, including reduced soil carbon content, water-holding capacity and porosity, and to environmental pollution. This layer displays the areas of concern for high-input agriculture related issues derived from the convergence of global evidence of human-environment interactions that can have land degradation consequences.
This layer is part of the World Altas of Desertification
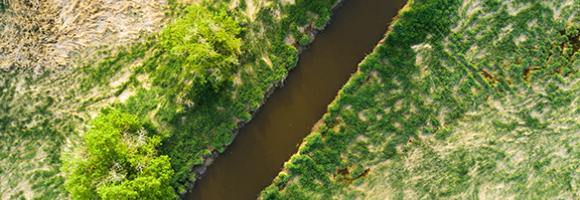

In 2020, a group of researchers carried out analysis to examine the importance of Indigenous Peoples’ lands for preserving Intact Forest Landscapes.(Fa et al.2020)They used geospatial data on the extent of Indigenous Peoples’ lands reported by Garnett et al. (2018), and Geospatial data for IFLs were sourced from the Intact Forest Landscapes website (www.intactforests.org) for the years 2000, 2013, and 2016 (Potapov et al. 2017)In the paper they have shown that the proportion of Indigenous Peoples’ lands mapped as IFLs was considerably higher (10.9%) than the proportion of other lands (defined here as all land outside Indigenous Peoples’ lands) mapped as IFLs (6.8%).
In this map we reported the percentage of Intact Forest Lansdcapes reduction in Indigenous People Lands for the period 2000-2016. IN the table we reported also the percentage of IFLs reduction in other lands. To explore more IFLs conservation strategies for African, Caribbean and Pacific countries you can check BIOPAMA Geonode Layers
Sources:
Fa JE, Watson JE, Leiper I, Potapov P, Evans TD, Burgess ND, Molnár Z, Fernández‐Llamazares Á, Duncan T, Wang S, Austin BJ. Importance of Indigenous Peoples’ lands for the conservation of Intact Forest Landscapes. Frontiers in Ecology and the Environment. 2020 Apr;18(3):135-4
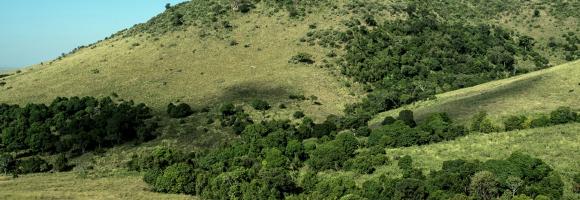
The EC JRC global map of forest cover provides a spatially explicit representation of forest presence and absence for the year 2020 at 10m spatial resolution.
The year 2020 corresponds to the cut-off date of the Regulation from the European Union "on the making available on the Union market and the export from the Union of certain commodities and products associated with deforestation and forest degradation" (EUDR, Regulation (EU) 2023/1115). In the context of the EUDR, the global forest cover map can be used as a non-mandatory, non-exclusive, and not legally binding source of information. Further information about the map and its use can be found on the EU Observatory on Deforestation and Forest Degradation (EUFO) in the section on Frequently Asked Questions.
Forest means land spanning more than 0.5 hectares with trees higher than 5 meters and a canopy cover of more than 10%, or trees able to reach those thresholds in situ, excluding land that is predominantly under agricultural or urban land use. Agricultural use means the use of land for the purpose of agriculture, including for agricultural plantations (i.e. tree stands in agricultural production systems such as fruit tree plantations, oil palm plantations, olive orchards and agroforestry systems) and set- aside agricultural areas, and for rearing livestock. All plantations of relevant commodities other than wood, that is cattle, cocoa, coffee, oil palm, rubber, soya, are excluded from the forest definition.
The global map of forest cover was created by combining available global datasets (wall-to-wall or global in their scope) on tree cover, tree height, land cover and land use into a single harmonized globally-consistent representation of where forests existed in 2020.
The workflow consisted in first mapping the global maximum extent of tree cover circa the year 2020 from the combination of ESA World Cover 2020 and 2021, WRI Tropical Tree Cover 2020, UMD Global land cover and land use 2019, Global Mangrove Watch 2020, and JRC Tropical Moist Forest 2020 datasets. In the second step, a series of overlays and decision rules were applied to reduce this maximum extent of tree cover and align it with the Forest definition using datasets covering cropland and commodity expansion (ESA World Cereal, UMD Global land cover and land use 2019, UMD Global Cropland Expansion, High-resolution global map of smallholder and industrial oil palm plantations, and WRI Spatial Database of Planted Trees), land use change (UMD global forest cover loss, JRC Tropical Moist Forest, IIASA Global Forest Management), built-up (JRC Global Human Settlement), and water (JRC Global Surface Water).
The detailed mapping approach will be described in a separate technical report expected to be released by March 2024. The accuracy of this map has not been yet assessed but will be reported as soon as available.
Please also refer to the list of known issues and to the JRC Data Catalogue entry.
Land cover is defined as the physical material at the surface of the earth, usually documented via the interpretation of earth observations. Common land cover types include trees, grass, bare ground, built up areas, water, etc. How well are different ecosystem types (as indicated by land cover) preserved and how strong are anthropogenic changes affecting their distribution in a given area? Human pressures are constantly increasing and it is important to monitor the consequences of the associated changes on the environment. This map shows the changes in land cover between 1995 and 2015.
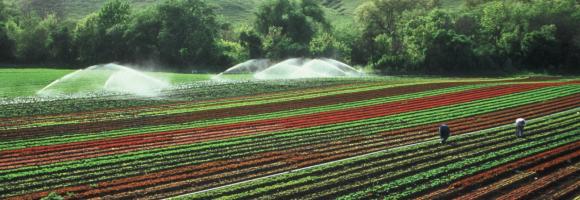
Humans need increasingly more biomass for food, fodder, fiber and energy. In Africa, circa 22% of the vegetated land surface showed a decline or unstable land productivity between 1999 and 2013. Persistent reduction of land productivity points to long-term alteration of the health and productive capacity of the land, which are characteristic of land degradation. It has impact on ecosystem services and benefits, thus on the sustainable livelihoods of human communities. This map shows the dynamics of (vegetated) land productivity over a time period, in other terms the trajectories of above-ground biomass. It reflects changes in ecosystem functioning e.g. vegetation growth cycles due to natural variation and/or human intervention, and can be associated with processes of land degradation or recovery. The 5 classes depict two levels of persistent productivity decline, one level of instability or stress in capacity, one level of stable productivity and one level of increased productivity.
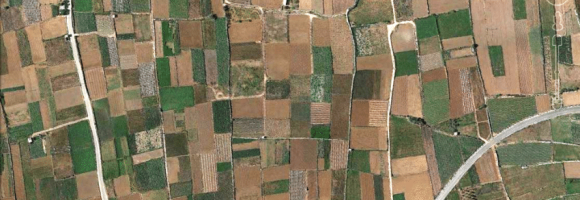
Habitat fragmentation occurs when natural habitat is broken up by non-natural land uses. For this layer, land fragmentation is expressed as the Natural Land Cover Pattern Index (NLPI), which classifies natural or semi-natural landcover into six spatial pattern classes: core, edge, perforation, islet, margin, and core-opening. Natural landcover pixels from Climate Change Initiative Land Cover (CCI-LC) raster maps are classified as ‘core’ habitat. Non-natural land cover pixels within core habitat are classified as ‘core openings’ as these represent openings from within natural habitat. External interfaces between core and non-natural landcover are classified as ‘edges’ (i.e. exposed to outside-in habitat loss pressures), while internal interfaces between core and core-openings are classified as ‘perforations’ (i.e. exposed to inside-out habitat loss pressure). Collections of isolated natural landcover pixels that are too small to contain core habitat are classified as ‘islets’, while similarly small collections of pixels are classified as ‘margins’ when they are connected to core habitats.
Humans need increasingly more biomass for food, fodder, fiber and energy. In Africa, circa 22% of the vegetated land surface showed a decline or unstable land productivity between 1999 and 2013. Persistent reduction of land productivity points to long-term alteration of the health and productive capacity of the land, which are characteristic of land degradation. It has impact on ecosystem services and benefits, thus on the sustainable livelihoods of human communities. This map shows the dynamics of (vegetated) land productivity over a time period, in other terms the trajectories of above-ground biomass. It reflects changes in ecosystem functioning e.g. vegetation growth cycles due to natural variation and/or human intervention, and can be associated with processes of land degradation or recovery. The 5 classes depict two levels of persistent productivity decline, one level of instability or stress in capacity, one level of stable productivity and one level of increased productivity.
Smallholder farmers have limited access to capital and are reluctant to trade their low-risk system (low input and low yield) to a high-risk system (high input and potentially higher yields). But Insufficient application of fertilizer on agricultural land may lead to soil nutrients depletion, lower yields, and eventually land abandonment. This layer displays the areas of concern for low-input agriculture related issues derived from the convergence of global evidence of human-environment interactions that can have land degradation consequences.
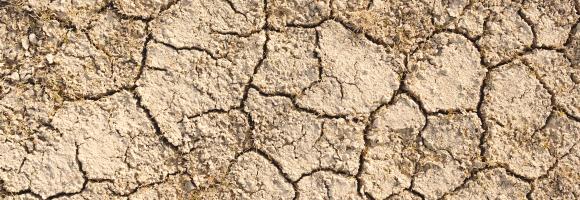
Droughts affect millions of people in the world each year and have long-lasting socioeconomic impacts. They can occur over most parts of the world, even in wet and humid regions, and can profoundly impact agriculture, basic household welfare, tourism, ecosystems and the services they provide. The Risk of Drought Impact for Agriculture (RDrI-Agri) is a categorized risk index, indicating the probability of having impacts from a drought, with particular focus on vegetation. Higher risk (in red) means that the areas affected will be the most likely to report impacts due to droughts. It is updated every ten days.
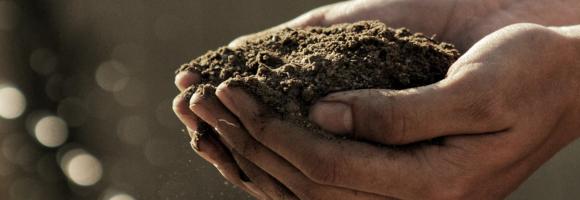
In most people's mind, soil would not figure highly in a list of the natural resources of Africa. However, healthy and fertile soils are the cornerstones of food security, key environmental services, social cohesion and the economies of most African countries. Unfortunately, soil in Africa tends to reach public awareness only when it fails – often with catastrophic consequences as seen by the famine episodes of the Sahel in the 1980s and more recently in Niger and the Horn of Africa. In the context of major global environmental challenges such as food security, climate change, fresh water scarcity and biodiversity loss, the protection and the sustainable management of soil resources in Africa are of paramount importance. This layer presents the diversity of soil types across Africa. This map was produced by the Joint Research Centre of the European Commission for the Soil Atlas of Africa.
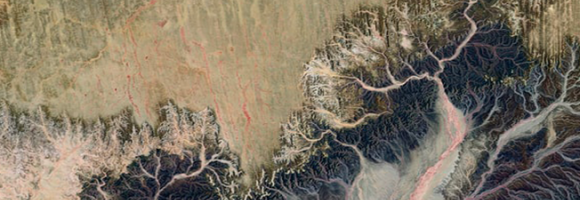
Organisms and non-living elements of the environment such as climate, soil, and water are connected through the movement of nutrients and energy in ecosystems. Ecosystems represent specific areas where organisms and environmental conditions create a network of interactions and are affected by forces such as disturbance (temporary change in environmental conditions that causes a pronounced change) and succession (process of change in the species structure of an ecological community over time). This layer maps the Ecosystems of Africa, based on Africa's climate regions, topography and lithology (bedrock), with a 100m spatial resolution.
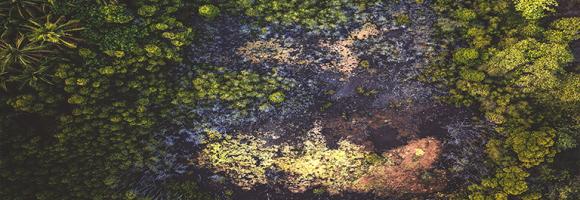
Tropical moist forests have a huge environmental value. They play an important role in biodiversity conservation, terrestrial carbon cycle, hydrological regimes, indigenous population subsistence and human health (1-5). They are increasingly recognized as an essential element of any strategy to mitigate climate change. Deforestation, and degradation compromise the functioning of tropical forests as an ecosystem, lead to biodiversity loss and reduced carbon storage capacity. Deforestation and fragmentation are increasing the risk of virus disease outbreaks. This map shows where deforestation occurred in the last three decades (between 1982 and 2020) and the year when the forest cover has been deforested for the first time (followed or not by a regrowth).
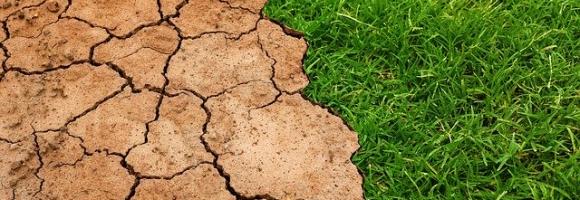
Tropical moist forests have a huge environmental value. They play an important role in biodiversity conservation, terrestrial carbon cycle, hydrological regimes, indigenous population subsistence and human health (1-5). They are increasingly recognized as an essential element of any strategy to mitigate climate change. Deforestation, and degradation compromise the functioning of tropical forests as an ecosystem, lead to biodiversity loss and reduced carbon storage capacity. Deforestation and fragmentation are increasing the risk of virus disease outbreaks. This map shows where degradation occurred in the last three decades (between 1982 and 2020) and the year when the forest has been degraded for the first time (and remained degraded up to 2020).
Tropical moist forests have a huge environmental value. They play an important role in biodiversity conservation, terrestrial carbon cycle, hydrological regimes, indigenous population subsistence and human health (1-5). They are increasingly recognized as an essential element of any strategy to mitigate climate change. Accurate characterization of the tropical moist forests changes is needed to support conservation policies and to better quantify their contribution to global carbon fluxes. The transition map captures the dynamics of changes in tropical moist forests between the initial observation period (1990) and the end of the year 2020.
Crop conditions monitoring is highly relevant for food security early warning and response planning in food-insecure areas of the world. GEOGLAM (the Group on Earth Observations' Global Agricultural Monitoring Initiative) aims to reinforce the international community's capacity to produce and disseminate relevant, timely, and accurate forecasts of agricultural production at national, regional, and global scales using Earth Observation data.
Copernicus4GEOGLAM, one of the Copernicus Land Monitoring Services managed by the EC Joint Research Centre, aims to produce baseline information that allows countries in Africa to improve their agricultural monitoring systems.
This dataset aggregates crop maps requested by three East African nations, showing the agricultural situation at the end of the long rain season of 2021. The results are made fully and freely accessible, covering the following areas:
This dataset provides a continent-wide, raster-based spatial representation of Earth's surface heat flow across the African tectonic plate for the year 2013, modeled under a historical baseline scenario. The data quantifies the amount of thermal energy moving from the Earth's interior to its surface, with values explicitly expressed in watts per square meter (W/m²). This resource is critical for identifying geothermal potential, understanding tectonic anomalies, and supporting broader geoscientific and energy research.
Sources and ContextThis layer is part of the Geothermal Atlas for Africa developed within the LEAP-RE project
This dataset comprises a collection of shapefiles detailing the geographical locations and attributes of various wells across Africa, with a strong focus on geothermal exploration and assessment. Together, these layers offer a valuable resource for geothermal energy planning, subsurface geological analysis, and infrastructure mapping. The collection includes the following spatial data layers:
These layers are part of the Geothermal Atlas for Africa developed within the LEAP-RE project"
This dataset compiles geophysical models detailing the thickness of the Earth's outer layers, ranging from surface sedimentary basins down to the base of the lithosphere. The collection serves a dual purpose: it provides broad, global baseline data for sediment distribution, while also offering high-resolution, integrated regional models specifically focused on the African plate.
Dataset Contents:
I. Global Baselines
II. African Regional Models
These layers are part of the Geothermal Atlas for Africa developed within the LEAP-RE project
This dataset shows the location of hydrocarbon provinces with proven petroleum reserves. This data was compiled as part of the USGS's World Energy Project (WEP).
This dataset is part of the LEAP-RE project collection. For more information visit https://www.leap-re.eu/
Development test dataset: random 0-100 values on the 0.35° Nature Africa grid clipped to the DRC. Not real data.