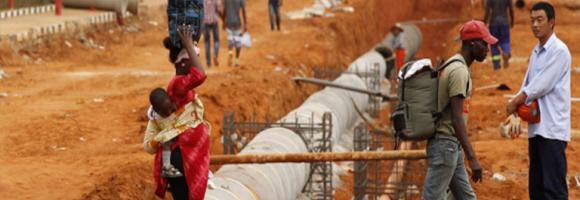
How do development projects influence the geographic distribution of economic activity within low-income and middle-income countries? Existing research focuses on the effects of Western development projects on inter-personal inequality and inequality across different subnational regions. However, China has become a major financier of economic infrastructure in Africa. This dataset geo-locates Chinese Government-financed projects between 2000 and 2014. It captures 3,485 projects worth $273.6 billion in total official financing. It includes both Chinese aid and non-concessional official financing. Chinese development projects in general, and Chinese transportation projects in particular, appear to reduce economic inequality within and between subnational localities.
This dataset shows the African power plants by energy generation type. It includes thermal plants (coal, gas, oil, nuclear, biomass, waste, geothermal) and renewables (hydro, wind, solar). Each power plant is geolocated and entries contain information on plant capacity and generation type.
This map provides a spatially explicit characterization of 47 terrestrial habitat types, as defined in the International Union for Conservation of Nature (IUCN) habitat classification scheme, which is widely used in ecological analyses, including for quantifying species’ Area of Habitat. The map broadens our understanding of habitats globally, assist in constructing area of habitat refinements, and are relevant for broad-scale ecological studies and future IUCN Red List assessments. Periodic updates are planned as better or more recent data becomes available.
This map provides a spatially explicit characterization of 47 terrestrial habitat types, as defined in the International Union for Conservation of Nature (IUCN) habitat classification scheme, which is widely used in ecological analyses, including for quantifying species’ Area of Habitat. The map broadens our understanding of habitats globally, assist in constructing area of habitat refinements, and are relevant for broad-scale ecological studies and future IUCN Red List assessments. Periodic updates are planned as better or more recent data becomes available.
This dataset provides projections of global rainfall erosivity changes, a critical metric representing the erosive force of rainfall that drives worldwide soil and nutrient loss. These maps serve as essential inputs for global and regional soil erosion assessment models. The collection details the geographical distribution of projected erosivity changes across two primary periods: 2010–2050 and 2050–2070. To account for different climate trajectories, the dataset includes models for three distinct Representative Concentration Pathway (RCP) scenarios for both timeframes: RCP 2.6 (stringent mitigation), RCP 4.5 (intermediate emissions), and RCP 8.5 (high emissions). By combining these temporal and climatic variables, users can evaluate and compare potential future soil erosion risks under varying degrees of global climate change.