Main navigation
User account menu
Language

Substantial crop losses occur at various stages along the postharvest value chain. Losses result from poor handling and storage practices combined with limited awareness, infrastructure, and knowledge. The African Postharvest Losses Information System (APHLIS) (www.aphlis.net) is the foremost international effort to collect, analyse and disseminate data on postharvest losses of cereal grains in sub-Saharan Africa. The cumulative % loss in weight incurred during harvesting, drying, threshing/shelling, winnowing, household-level storage, transport and market-level storage for the selected crop, location, and year is presented. Complimentary data sets are collected and used to convert this % loss into absolute loss values in tonnes, US$ and nutrients, along with the nutritional and financial impacts of these losses by province and country. Understanding the magnitude of postharvest loss, the points in the value chain where losses occur, and the causes and impacts of loss helps decision-makers formulate effective policies and invest in successful postharvest loss programmes.
Substantial crop losses occur at various stages along the postharvest value chain. Losses result from poor handling and storage practices combined with limited awareness, infrastructure, and knowledge. The African Postharvest Losses Information System (APHLIS) (www.aphlis.net) is the foremost international effort to collect, analyse and disseminate data on postharvest losses of cereal grains in sub-Saharan Africa. The cumulative % loss in weight incurred during harvesting, drying, threshing/shelling, winnowing, household-level storage, transport and market-level storage for the selected crop, location, and year is presented. Complimentary data sets are collected and used to convert this % loss into absolute loss values in tonnes, US$ and nutrients, along with the nutritional and financial impacts of these losses by province and country. Understanding the magnitude of postharvest loss, the points in the value chain where losses occur, and the causes and impacts of loss helps decision-makers formulate effective policies and invest in successful postharvest loss programmes.
Substantial crop losses occur at various stages along the postharvest value chain. Losses result from poor handling and storage practices combined with limited awareness, infrastructure, and knowledge. The African Postharvest Losses Information System (APHLIS) (www.aphlis.net) is the foremost international effort to collect, analyse and disseminate data on postharvest losses of cereal grains in sub-Saharan Africa. The cumulative % loss in weight incurred during harvesting, drying, threshing/shelling, winnowing, household-level storage, transport and market-level storage for the selected crop, location, and year is presented. Complimentary data sets are collected and used to convert this % loss into absolute loss values in tonnes, US$ and nutrients, along with the nutritional and financial impacts of these losses by province and country. Understanding the magnitude of postharvest loss, the points in the value chain where losses occur, and the causes and impacts of loss helps decision-makers formulate effective policies and invest in successful postharvest loss programmes.
Substantial crop losses occur at various stages along the postharvest value chain. Losses result from poor handling and storage practices combined with limited awareness, infrastructure, and knowledge. The African Postharvest Losses Information System (APHLIS) (www.aphlis.net) is the foremost international effort to collect, analyse and disseminate data on postharvest losses of cereal grains in sub-Saharan Africa. The cumulative % loss in weight incurred during harvesting, drying, threshing/shelling, winnowing, household-level storage, transport and market-level storage for the selected crop, location, and year is presented. Complimentary data sets are collected and used to convert this % loss into absolute loss values in tonnes, US$ and nutrients, along with the nutritional and financial impacts of these losses by province and country. Understanding the magnitude of postharvest loss, the points in the value chain where losses occur, and the causes and impacts of loss helps decision-makers formulate effective policies and invest in successful postharvest loss programmes.
Substantial crop losses occur at various stages along the postharvest value chain. Losses result from poor handling and storage practices combined with limited awareness, infrastructure, and knowledge. The African Postharvest Losses Information System (APHLIS) (www.aphlis.net) is the foremost international effort to collect, analyse and disseminate data on postharvest losses of cereal grains in sub-Saharan Africa. The cumulative % loss in weight incurred during harvesting, drying, threshing/shelling, winnowing, household-level storage, transport and market-level storage for the selected crop, location, and year is presented. Complimentary data sets are collected and used to convert this % loss into absolute loss values in tonnes, US$ and nutrients, along with the nutritional and financial impacts of these losses by province and country. Understanding the magnitude of postharvest loss, the points in the value chain where losses occur, and the causes and impacts of loss helps decision-makers formulate effective policies and invest in successful postharvest loss programmes.

Côte d'Ivoire and Ghana are the main largest producers of cocoa in the world. However, the cultivation of this crop has led to the loss of vast tracts of forest areas in both countries. Efficient and accurate methods for remotely identifying cocoa farms are essential for the implementation of sustainable cocoa practices and the periodic and effective monitoring of forests. This map, generated using Random Forest image classification, shows the 2019 distribution of cocoa farms in both countries. The estimated area for cocoa is 4.8Mha for Cote d'Ivoire and 2.3Mha for Ghana.

Percentage of cohort of young people three to five years older than the intended age for the last grade of upper secondary level of education who have completed that level of education. This indicator measures the potential impact of electricity on youth education, that represents a crucial pillar for the development of a country.

Estimated number of jobs created directly related to the deployment of PV mini-grids. The indicator was calculated using data on the total MWh of electricity output anticipated if the total number of potential mini-grids were established within each country and the employment factors come from OECD. If the estimated number of jobs created is high, it means that PV mini-grids have a large potential both in terms of deployment and social development.

The hydropower installed capacity indicates the amount of energy a hydropower plant can produce in its turbines. In 2016, hydropower accounted for 54% of the installed capacity in Eastern Africa, 58% in Central Africa and 30% in Western Africa with fourteen countries having a hydropower share above 50% and eight countries above 70%. These highly hydropower-dependent countries are particularly prone to electricity cuts due to the lack of water caused by severe droughts. This map shows the location and installed capacities of hydropower plants above 5MW installed capacity in Africa for year 2016, representing 95% of the total hydropower installed capacity in Africa.
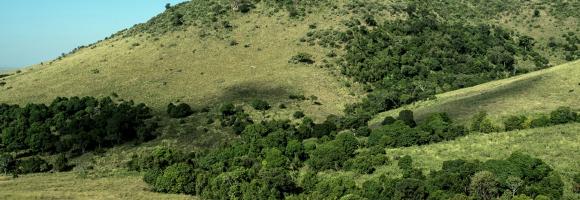
The EC JRC global map of forest cover provides a spatially explicit representation of forest presence and absence for the year 2020 at 10m spatial resolution.
The year 2020 corresponds to the cut-off date of the Regulation from the European Union "on the making available on the Union market and the export from the Union of certain commodities and products associated with deforestation and forest degradation" (EUDR, Regulation (EU) 2023/1115). In the context of the EUDR, the global forest cover map can be used as a non-mandatory, non-exclusive, and not legally binding source of information. Further information about the map and its use can be found on the EU Observatory on Deforestation and Forest Degradation (EUFO) in the section on Frequently Asked Questions.
Forest means land spanning more than 0.5 hectares with trees higher than 5 meters and a canopy cover of more than 10%, or trees able to reach those thresholds in situ, excluding land that is predominantly under agricultural or urban land use. Agricultural use means the use of land for the purpose of agriculture, including for agricultural plantations (i.e. tree stands in agricultural production systems such as fruit tree plantations, oil palm plantations, olive orchards and agroforestry systems) and set- aside agricultural areas, and for rearing livestock. All plantations of relevant commodities other than wood, that is cattle, cocoa, coffee, oil palm, rubber, soya, are excluded from the forest definition.
The global map of forest cover was created by combining available global datasets (wall-to-wall or global in their scope) on tree cover, tree height, land cover and land use into a single harmonized globally-consistent representation of where forests existed in 2020.
The workflow consisted in first mapping the global maximum extent of tree cover circa the year 2020 from the combination of ESA World Cover 2020 and 2021, WRI Tropical Tree Cover 2020, UMD Global land cover and land use 2019, Global Mangrove Watch 2020, and JRC Tropical Moist Forest 2020 datasets. In the second step, a series of overlays and decision rules were applied to reduce this maximum extent of tree cover and align it with the Forest definition using datasets covering cropland and commodity expansion (ESA World Cereal, UMD Global land cover and land use 2019, UMD Global Cropland Expansion, High-resolution global map of smallholder and industrial oil palm plantations, and WRI Spatial Database of Planted Trees), land use change (UMD global forest cover loss, JRC Tropical Moist Forest, IIASA Global Forest Management), built-up (JRC Global Human Settlement), and water (JRC Global Surface Water).
The detailed mapping approach will be described in a separate technical report expected to be released by March 2024. The accuracy of this map has not been yet assessed but will be reported as soon as available.
Please also refer to the list of known issues and to the JRC Data Catalogue entry.
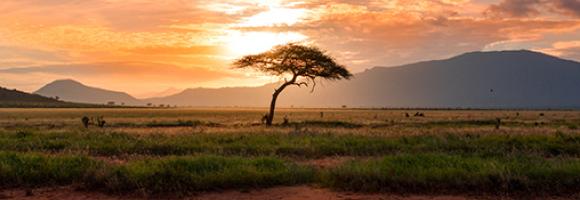
Some areas in Africa represent spectacular, still viable examples of Africa’s wildlife and wild places. They are of such outstanding importance and value that they should be conserved at all costs and in principle forever. Those areas are referred to as Key Landscapes for Conservation or KLCs. A suitable network of KLCs has the potential to protect the well-known wildlife species within natural ecosystems and to stimulate rural economic growth.
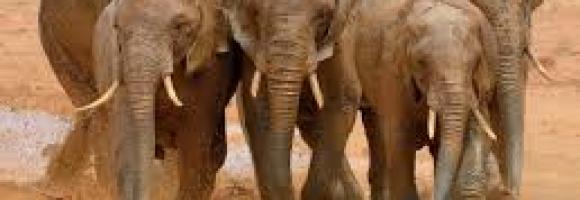
<p>This spatial dataset contains the geographic boundaries and ecological evaluations of 45 Key Landscapes for Conservation and Development (KLCDs) across Sub-Saharan Africa. Building on the <a href="https://africa-knowledge-platform.ec.europa.eu/dataset/key-landscapes-c…; Key Landscapes for Conservation (KLCs) </a> identified in the EU report <a href="https://op.europa.eu/sl/publication-detail/-/publication/d76ac7eb-bc4a-…;“Larger than elephants”</a>, the NaturAfrica initiative is rolled out across these key biodiversity and development landscapes.</p>
<p>NaturAfrica's efforts are concentrated on ‘mega-landscapes’—biogeographical regions identified as crucial for both conservation and development. These regions encompass:</p>
<ul>
<li>The forest ecosystems of the Congo Basin;</li>
<li>Landscapes of transhumance pastoralists in North Cameroon, the Central African Republic, and Chad;</li>
<li>Guinean forests of West Africa;</li>
<li>Savannahs in the Sudano-Sahelian zone of West Africa;</li>
<li>Savannahs and watersheds of the East Africa rift;</li>
<li>Transfrontier conservation areas of Southern Africa.</li>
</ul>
<p>The layer was developed to support the prioritization of intervention areas for the second phase of this initiative, which combines conservation with sustainable job creation. It provides a spatially explicit characterization of ecological value across these landscapes, evaluated and attributed based on five core ecological and environmental dimensions:</p>
<ul>
<li><span class="label">Threatened Species Richness:</span> Concentration and diversity of threatened species.</li>
<li><span class="label">Species Endemicity:</span> Presence of endemic species unique to the specific geographic region.</li>
<li><span class="label">Ecosystem Integrity:</span> The integrity of protected and conserved areas, accounting for degrees of human modification and habitat fragmentation.</li>
<li><span class="label">Ecological Connectivity:</span> The degree of connectivity and spatial linkages between protected and conserved areas.</li>
<li><span class="label">Ecosystem Services:</span> Provisioning and regulating services, with a specific focus on carbon storage and water services.</li>
</ul>
<strong>Purpose</strong>
<p>The layer was created to inform the EC Directorate General for International Partnerships (DG INTPA) and policymakers in selecting and prioritizing funding intervention areas based on specific targets (e.g., species conservation, connectivity, or water security) within different biogeographical regions. It serves as a spatial decision-support tool to align with the European Green Deal and the EU Biodiversity Strategy for 2030.</p>
<strong>Geographic Extent</strong>
<ul>
<li><span class="label">Region:</span> Sub-Saharan Africa</li>
<li><span class="label">Coverage:</span> 45 distinct Key Landscapes for Conservation and Development (KLCDs)</li>
</ul>
<strong>Keywords</strong>
<ul>
<li><span class="label">Thematic:</span> Biodiversity Conservation, NaturAfrica, Ecosystem Services, Protected Areas, Habitat Connectivity, Species Endemicity, European Green Deal, Ecosystem Integrity, Transfrontier Conservation, Mega-landscapes.</li>
<li><span class="label">Spatial:</span> Sub-Saharan Africa, Congo Basin, West Africa, East Africa, Southern Africa, Sudano-Sahelian zone.</li>
</ul>
<strong>Lineage / Data Source</strong>
<p>This dataset is derived from the <a href="https://publications.jrc.ec.europa.eu/repository/handle/JRC145021"> technical assessment conducted for the European Commission Knowledge Centre for Biodiversity (KCBD) </a>.</p>
Droughts affect millions of people in the world each year and have long-lasting socioeconomic impacts. They can occur over most parts of the world, even in wet and humid regions, and can profoundly impact agriculture, basic household welfare, tourism, ecosystems and the services they provide. The Risk of Drought Impact for Agriculture (RDrI-Agri) is a categorized risk index, indicating the probability of having impacts from a drought, with particular focus on vegetation. Higher risk (in red) means that the areas affected will be the most likely to report impacts due to droughts. It is updated every ten days.

Forests worldwide are in a state of flux, with accelerating losses in some regions and gains in others. Given the recognized importance of forest ecosystem services, quantification of global forest extent and change is needed. This map displays the forest loss during the period 2000–2018, defined as a stand-replacement disturbance, or a change from forest to non-forest state. It is expressed as either 1 (loss - in red) or 0 (no loss).

Forests are the most biologically diverse land ecosystems and are critical for sustaining local and global livelihoods. Deforestation can be considered a type of land degradation when forest ecosystems, with all of their important provisioning, regulating and cultural services, are exchanged for another land use, such as crop agriculture, with a narrow provisioning service focus. Damages to the land resource include the immediate reduction or loss of biomass productivity with a linked loss in habitat, biodiversity, and carbon stock. Clearance of natural forests accelerates soil erosion and the alteration of soil functioning. This layer displays the areas of concern for tree loss issues, derived from the convergence of global evidence of human-environment interactions that can have consequences on land degradation.
Crop conditions monitoring is highly relevant for food security early warning and response planning in food-insecure areas of the world. GEOGLAM (the Group on Earth Observations' Global Agricultural Monitoring Initiative) aims to reinforce the international community's capacity to produce and disseminate relevant, timely, and accurate forecasts of agricultural production at national, regional, and global scales using Earth Observation data.
Copernicus4GEOGLAM, one of the Copernicus Land Monitoring Services managed by the EC Joint Research Centre, aims to produce baseline information that allows countries in Africa to improve their agricultural monitoring systems.
This dataset aggregates crop maps requested by three East African nations, showing the agricultural situation at the end of the long rain season of 2021. The results are made fully and freely accessible, covering the following areas:
Higher energy demands in Africa has led to a wide expansion of the number of hydropower sites, mainly between the 1960s and 1980s. The construction of dams causes impoundments of rivers and reservoirs in the regions of dam influence, with higher evaporation and water temperatures due to increased water surfaces. This map shows the he surface area (sqkm) of African reservoirs subject to hydropower production for the year 2016. It includes reservoirs of associated hydropower plants with installed capacities above 5MW. Apart from this, only reservoirs with a detected dam-caused impoundment of water surface are considered.
