Main navigation
User account menu
Language
Humans need increasingly more biomass for food, fodder, fiber and energy. In Africa, circa 22% of the vegetated land surface showed a decline or unstable land productivity between 1999 and 2013. Persistent reduction of land productivity points to long-term alteration of the health and productive capacity of the land, which are characteristic of land degradation. It has impact on ecosystem services and benefits, thus on the sustainable livelihoods of human communities. This map shows the dynamics of (vegetated) land productivity over a time period, in other terms the trajectories of above-ground biomass. It reflects changes in ecosystem functioning e.g. vegetation growth cycles due to natural variation and/or human intervention, and can be associated with processes of land degradation or recovery. The 5 classes depict two levels of persistent productivity decline, one level of instability or stress in capacity, one level of stable productivity and one level of increased productivity.

Humans need increasingly more biomass for food, fodder, fibre and energy. Meeting these demands changes global ecosystems. Tracking changes in total biomass production or land productivity is an essential part of monitoring land transformations that are typically associated with land degradation. Land productivity dynamics (LPD) are used as an indicator of change or stability of the land’s capacity to sustain primary production. This layer displays the areas of concern for land productivity related issues, derived from the convergence of global evidence of human-environment interactions that can have consequences on land degradation.

This dataset provides the P50 projections for a geothermal system utilizing a Chiller unit.
Chiller refers to an absorption chiller or heat pump integrated into the geothermal system. It is used to provide cooling (by utilizing the geothermal heat) or to extract additional heat from the return fluid, thereby increasing the system's overall thermal harvest.
P50 is a statistical term used in risk analysis and forecasting. P50 represents the median scenario, meaning there is a 50% probability that the actual outcome will be higher than this value and a 50% probability it will be lower. It serves as the baseline "best estimate."
Metrics DefinitionsCoefficient of Performance (COP) [-]: A measure of efficiency, defined as the ratio of useful heating or cooling provided to the work (energy) required to operate the Chiller. Higher values indicate greater efficiency.
Doublet Net Production [MW]: The actual useful power output (Megawatts) generated by the "doublet" (one production well + one injection well), subtracting any energy used by pumps or auxiliary equipment.
Levelized Cost of Energy (LCOE) [US$ct/kWh]: The average revenue per unit of energy needed to recover the cost of building and operating the plant over its entire life cycle. It essentially represents the break-even price.
Net Present Value (NPV) [million US$]: The current financial value of all future cash flows the project will generate, minus the initial investment costs. A positive NPV generally indicates a profitable project.
Optimized Depth of the Aquifer [m]: The calculated ideal drilling depth (meters) to reach the geothermal reservoir that balances drilling costs with temperature/flow benefits.
Production Flow Rate [m³/h]: The volume of geothermal fluid extracted from the reservoir per hour (cubic meters per hour).
Temperature at Reservoir [°C]: The natural temperature (Celsius) of the geothermal fluid within the subsurface rock formation before it is brought to the surface.
Transmissivity [Dm]: A measure of how easily fluid flows through the porous aquifer. It is the product of hydraulic conductivity and aquifer thickness (often measured in Darcy-meters). High transmissivity means easier extraction.
Well Distance [m]: The physical distance (meters) between the production well (extraction) and the injection well (return). Proper spacing prevents "short-circuiting," where cool injected water lowers the temperature of the production well too quickly.
This dataset provides the P50 projections for a Direct Heat geothermal system.
Direct Heat refers to the use of geothermal energy for applications such as space heating, industrial processes, or agriculture. In the utilized model, it is assumed a minimum production temperature of at least 60°C and a reinjection temperature of 40°C.
P50 is a statistical term used in risk analysis and forecasting. P50 represents the median scenario, meaning there is a 50% probability that the actual outcome will be higher than this value and a 50% probability it will be lower. It serves as the baseline "best estimate."
Metrics DefinitionsCoefficient of Performance (COP) [-]: A measure of efficiency, defined as the ratio of useful heating or cooling provided to the work (energy) required to operate the Chiller. Higher values indicate greater efficiency.
Doublet Net Production [MW]: The actual useful power output (Megawatts) generated by the ""doublet"" (one production well + one injection well), subtracting any energy used by pumps or auxiliary equipment.
Levelized Cost of Energy (LCOE) [US$ct/kWh]: The average revenue per unit of energy needed to recover the cost of building and operating the plant over its entire life cycle. It essentially represents the break-even price.
Net Present Value (NPV) [million US$]: The current financial value of all future cash flows the project will generate, minus the initial investment costs. A positive NPV generally indicates a profitable project.
Optimized Depth of the Aquifer [m]: The calculated ideal drilling depth (meters) to reach the geothermal reservoir that balances drilling costs with temperature/flow benefits.
Production Flow Rate [m³/h]: The volume of geothermal fluid extracted from the reservoir per hour (cubic meters per hour).
Temperature at Reservoir [°C]: The natural temperature (Celsius) of the geothermal fluid within the subsurface rock formation before it is brought to the surface.
Transmissivity [Dm]: A measure of how easily fluid flows through the porous aquifer. It is the product of hydraulic conductivity and aquifer thickness (often measured in Darcy-meters). High transmissivity means easier extraction.
Well Distance [m]: The physical distance (meters) between the production well (extraction) and the injection well (return). Proper spacing prevents ""short-circuiting,"" where cool injected water lowers the temperature of the production well too quickly.
This dataset provides the P50 projections for a Direct Heat with Heat Pump geothermal system.
Direct Heat with Heat Pump refers to a scenario where a geothermal system is integrated with an industrial heat pump to upgrade low-grade heat. This allows for production from geothermal temperatures as low as 40°C, which are then heated by the pump to a delivery temperature of 80°C. The reinjection temperature is set to the production temperature minus 20°C, with a absolute minimum of 15°C.
P50 is a statistical term used in risk analysis and forecasting. P50 represents the median scenario, meaning there is a 50% probability that the actual outcome will be higher than this value and a 50% probability it will be lower. It serves as the baseline ""best estimate.""
Metrics DefinitionsCoefficient of Performance (COP) [-]: A measure of efficiency, defined as the ratio of useful heating or cooling provided to the work (energy) required to operate the Chiller. Higher values indicate greater efficiency.
Doublet Net Production [MW]: The actual useful power output (Megawatts) generated by the ""doublet"" (one production well + one injection well), subtracting any energy used by pumps or auxiliary equipment.
Levelized Cost of Energy (LCOE) [US$ct/kWh]: The average revenue per unit of energy needed to recover the cost of building and operating the plant over its entire life cycle. It essentially represents the break-even price.
Net Present Value (NPV) [million US$]: The current financial value of all future cash flows the project will generate, minus the initial investment costs. A positive NPV generally indicates a profitable project.
Optimized Depth of the Aquifer [m]: The calculated ideal drilling depth (meters) to reach the geothermal reservoir that balances drilling costs with temperature/flow benefits.
Production Flow Rate [m³/h]: The volume of geothermal fluid extracted from the reservoir per hour (cubic meters per hour).
Temperature at Reservoir [°C]: The natural temperature (Celsius) of the geothermal fluid within the subsurface rock formation before it is brought to the surface.
Transmissivity [Dm]: A measure of how easily fluid flows through the porous aquifer. It is the product of hydraulic conductivity and aquifer thickness (often measured in Darcy-meters). High transmissivity means easier extraction.
Well Distance [m]: The physical distance (meters) between the production well (extraction) and the injection well (return). Proper spacing prevents ""short-circuiting,"" where cool injected water lowers the temperature of the production well too quickly.
This dataset provides the P50 projections for an Organic Rankine Cycle (ORC) geothermal power plant.
Organic Rankine Cycle (ORC) refers to a binary power plant configuration where geothermal fluid (brine) is used to heat a secondary organic working fluid. This process allows for efficient electricity generation from medium-to-low temperature resources (typically 90°C to 150°C). The organic fluid vaporizes, drives a turbine, and is then condensed back into a liquid to repeat the cycle. The geothermal brine is reinjected into the reservoir after passing through the heat exchanger.
P50 is a statistical term used in risk analysis and forecasting. P50 represents the median scenario, meaning there is a 50% probability that the actual outcome will be higher than this value and a 50% probability it will be lower. It serves as the baseline ""best estimate.""
Metrics DefinitionsCoefficient of Performance (COP) [-]: A measure of efficiency, defined as the ratio of useful heating or cooling provided to the work (energy) required to operate the Chiller. Higher values indicate greater efficiency.
Doublet Net Production [MW]: The actual useful power output (Megawatts) generated by the ""doublet"" (one production well + one injection well), subtracting any energy used by pumps or auxiliary equipment.
Levelized Cost of Energy (LCOE) [US$ct/kWh]: The average revenue per unit of energy needed to recover the cost of building and operating the plant over its entire life cycle. It essentially represents the break-even price.
Net Present Value (NPV) [million US$]: The current financial value of all future cash flows the project will generate, minus the initial investment costs. A positive NPV generally indicates a profitable project.
Optimized Depth of the Aquifer [m]: The calculated ideal drilling depth (meters) to reach the geothermal reservoir that balances drilling costs with temperature/flow benefits.
Production Flow Rate [m³/h]: The volume of geothermal fluid extracted from the reservoir per hour (cubic meters per hour).
Temperature at Reservoir [°C]: The natural temperature (Celsius) of the geothermal fluid within the subsurface rock formation before it is brought to the surface.
Transmissivity [Dm]: A measure of how easily fluid flows through the porous aquifer. It is the product of hydraulic conductivity and aquifer thickness (often measured in Darcy-meters). High transmissivity means easier extraction.
Well Distance [m]: The physical distance (meters) between the production well (extraction) and the injection well (return). Proper spacing prevents ""short-circuiting,"" where cool injected water lowers the temperature of the production well too quickly.

Whether you’re monitoring crops, modelling green energy installations or soil sealing, combatting loss of natural resources or just helping countries meet their Sustainable Development Goals, chances are high that you’ll need an accurate and spatially detailed map on land cover and land use. Earth Observation satellites, like those from EU’s flagship programme Copernicus, are key to providing such maps, at a global scale, with free and open access. Land cover maps represent spatial information on different types (classes) of physical coverage of the Earth's surface, e.g. forests, grasslands, croplands, lakes, wetlands. Dynamic land cover maps include transitions of land cover classes over time and hence captures land cover changes. This dataset shows the land cover for the baseline year 2019 with a discrete classification in 23 classes aligned with UN-FAO's Land Cover Classification System.

Park managers in many countries across Africa need to monitor and understand their parks features and overall health. They can rely on the highly detailed land cover information offered by the Copernicus Hot Spot Land Cover Change Explorer for specific areas of interest –or hot spots. These areas were selected for their importance in biodiversity preservation (Protected Areas, Key Landscapes for Conservation...). For each land cover class (Natural vegetation, Wetlands, urbane areas, etc.), this layer shows which portions of the areas changed to another class over the period (2000-2019). For a more detailed analysis, compare the layer with the present landcover or refer to the online Explorer. The allows to monitor land cover and land cover change in high detail and make informed decisions based on spatial data.
Copernicus is the European flagship programme for monitoring the Earth. Data is collected by Earth observation satellites and sensors on the earth’s surface. The Copernicus Land Monitoring Service provides geographical information on land use and land cover at European and global scale. Derived from the Copernicus Hot Spot Land Cover Change Explorer, this layer presents detailed land cover information for specific areas of interest –or hot spots– in Africa. These areas were selected as a priority for mapping because of their importance in biodiversity preservation (Protected Areas, Key Landscapes for Conservation...). Park managers in many countries across Africa rely on this Copernicus product to monitor and understand their parks features and overall health. Mapping habitats, assessing pressure on land, identifying prime locations for species reintroduction or new areas to protect are just a few examples of how these data can be exploited.
Food crisis response planning can save lives if put in place in a timely manner. To do this, decision makers must be warned of climate extreme events impacting agricultural production. The Anomaly hotSpot of Agricultural Production tool (ASAP) is an online decision support system for early warning about hotspots of agricultural production anomaly (crop and rangeland), developed by the JRC for food security crises prevention and response planning anticipation. This map shows the frequency at which countries were classified as hotspots for agricultural production problems between 2004 and 2018. Hotspots are identified on a monthly basis.

Many African countries, especially in the Sub-Saharan region highly depend on hydropower which is one of the energy sources that are most affected by droughts. At the same time hydropower has a huge impact on water consumption (mainly through evaporation from reservoir surfaces) in comparison with other fuel types despite having higher densities of plants and installed capacities. Hydropower accounts for 15% of Africa’s energy production. This map shows the energy production (GWh) of hydropower plants with an installed capacity above 5MW, aggregated for each hydropower-generating country in Africa for year 2016.
The hydropower installed capacity indicates the amount of energy a hydropower plant can produce in its turbines. In 2016, hydropower accounted for 54% of the installed capacity in Eastern Africa, 58% in Central Africa and 30% in Western Africa with fourteen countries having a hydropower share above 50% and eight countries above 70%. These highly hydropower-dependent countries are particularly prone to electricity cuts due to the lack of water caused by severe droughts. This map shows the location and installed capacities of hydropower plants above 5MW installed capacity in Africa for year 2016, representing 95% of the total hydropower installed capacity in Africa.

In 2020, a group of researchers carried out analysis to examine the importance of Indigenous Peoples’ lands for preserving Intact Forest Landscapes.(Fa et al.2020)They used geospatial data on the extent of Indigenous Peoples’ lands reported by Garnett et al. (2018), and Geospatial data for IFLs were sourced from the Intact Forest Landscapes website (www.intactforests.org) for the years 2000, 2013, and 2016 (Potapov et al. 2017)In the paper they have shown that the proportion of Indigenous Peoples’ lands mapped as IFLs was considerably higher (10.9%) than the proportion of other lands (defined here as all land outside Indigenous Peoples’ lands) mapped as IFLs (6.8%).
In this map we reported the percentage of Intact Forest Lansdcapes reduction in Indigenous People Lands for the period 2000-2016. IN the table we reported also the percentage of IFLs reduction in other lands. To explore more IFLs conservation strategies for African, Caribbean and Pacific countries you can check BIOPAMA Geonode Layers
Sources:
Fa JE, Watson JE, Leiper I, Potapov P, Evans TD, Burgess ND, Molnár Z, Fernández‐Llamazares Á, Duncan T, Wang S, Austin BJ. Importance of Indigenous Peoples’ lands for the conservation of Intact Forest Landscapes. Frontiers in Ecology and the Environment. 2020 Apr;18(3):135-4
Land cover is defined as the physical material at the surface of the earth, usually documented via the interpretation of earth observations. Common land cover types include trees, grass, bare ground, built up areas, water, etc. How well are different ecosystem types (as indicated by land cover) preserved and how strong are anthropogenic changes affecting their distribution in a given area? Human pressures are constantly increasing and it is important to monitor the consequences of the associated changes on the environment. This map shows the changes in land cover between 1995 and 2015.
Humans need increasingly more biomass for food, fodder, fiber and energy. In Africa, circa 22% of the vegetated land surface showed a decline or unstable land productivity between 1999 and 2013. Persistent reduction of land productivity points to long-term alteration of the health and productive capacity of the land, which are characteristic of land degradation. It has impact on ecosystem services and benefits, thus on the sustainable livelihoods of human communities. This map shows the dynamics of (vegetated) land productivity over a time period, in other terms the trajectories of above-ground biomass. It reflects changes in ecosystem functioning e.g. vegetation growth cycles due to natural variation and/or human intervention, and can be associated with processes of land degradation or recovery. The 5 classes depict two levels of persistent productivity decline, one level of instability or stress in capacity, one level of stable productivity and one level of increased productivity.
Habitat fragmentation occurs when natural habitat is broken up by non-natural land uses. For this layer, land fragmentation is expressed as the Natural Land Cover Pattern Index (NLPI), which classifies natural or semi-natural landcover into six spatial pattern classes: core, edge, perforation, islet, margin, and core-opening. Natural landcover pixels from Climate Change Initiative Land Cover (CCI-LC) raster maps are classified as ‘core’ habitat. Non-natural land cover pixels within core habitat are classified as ‘core openings’ as these represent openings from within natural habitat. External interfaces between core and non-natural landcover are classified as ‘edges’ (i.e. exposed to outside-in habitat loss pressures), while internal interfaces between core and core-openings are classified as ‘perforations’ (i.e. exposed to inside-out habitat loss pressure). Collections of isolated natural landcover pixels that are too small to contain core habitat are classified as ‘islets’, while similarly small collections of pixels are classified as ‘margins’ when they are connected to core habitats.
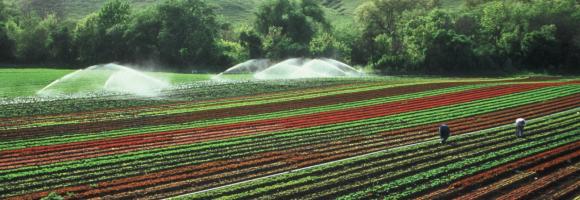
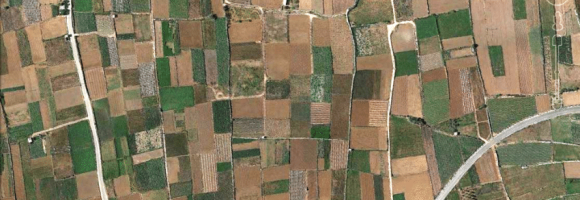
The map is based on Copernicus Global Land Cover data which shows actual land cover (what physically covers land across the globe—forests, grasslands, croplands, lakes, wetlands, built-up area, etc) at 100m x 100m resolution. The land cover data for Africa was overlaid on (high resolution) satellite imagery of Africa, which is then used to determine the land use (by visual interpretation) associated with the various land cover patterns on the Copernicus Global Land Cover map.
Copernicus land cover data offers several advantages: it is of high quality, has a high resolution (100m x 100m), and offers time series satellite imagery. More importantly, the Copernicus Global Land Service is a continuous process and its datasets are updated annually. This means that the Soils4Africa map of agricultural land can be updated every time the land cover data for the new year becomes available (the map is currently based on 2019 data).
The Copernicus dataset already includes the category ‘cropland,’ which by definition is part of agricultural land. The Soils4Africa map broadens the scope of that dataset by infering information on agricultural use and including other kinds of agricultural land use such as grazing pastures and plantations.
When land is mapped as other than ‘cropland'-- like ‘shrubland’ for example-- it is more difficult to interpret and determine whether it is under agricultural use. The Copernicus dataset includes information about ‘fractional cover’-- or the percentage of a particular pixel under a particular kind of land cover (for example, 30% of a 100m x 100m pixel could be forest and 20% could be shrubland). The Soils4Africa map takes into account how fractional cover varies over an area to establish rules for interpreting its land cover data to determine whether it is under agricultural use and for what purpose. These rules were validated by comparing it with ground level information on land use (or land use pattern) for specific areas drawn from the interpretation of satellite imagery from Google Earth.
For example, ground-level observation shows that forest cover upwards of 30% in a given area when matched by shrubland cover of over 30%, is characterized by woody vegetation with a smooth canopy. Therefore, such area is more likely to be under plantations rather than natural forest. Thus, such an area should be counted as agricultural land, even if less than 15% of it is under crops.
The Sahel is an area that, over time, has had multiple definitions, climatic-botanical and political: its limits have been traced in very different ways. Even the usage of this name and its delimitation on maps has been openly questioned and contested. Our contribution proposes a cartography capable of mapping the incessant movement of conditions, limits and possibilities that characterize this strip between the Sahara and the humid Sudanese regions, rendering the areal definition of the Sahel visible and fluid at the same time. However, it is a question of rethinking the very foundation of cartography – what has been ‘taken for granted’ in the past – such as the common tools of cartographic representation, for example the concept of ‘isohyet’ to identify climatic areas or ‘boundaries’ to define political jurisdictions. Knowledge from fieldwork and expertise in the processing of satellite and geo-referenced data converge in this path of analysis and representation.
The Sahel is an area that, over time, has had multiple definitions, climatic-botanical and political: its limits have been traced in very different ways. Even the usage of this name and its delimitation on maps has been openly questioned and contested. Our contribution proposes a cartography capable of mapping the incessant movement of conditions, limits and possibilities that characterize this strip between the Sahara and the humid Sudanese regions, rendering the areal definition of the Sahel visible and fluid at the same time. However, it is a question of rethinking the very foundation of cartography – what has been ‘taken for granted’ in the past – such as the common tools of cartographic representation, for example the concept of ‘isohyet’ to identify climatic areas or ‘boundaries’ to define political jurisdictions. Knowledge from fieldwork and expertise in the processing of satellite and geo-referenced data converge in this path of analysis and representation. The Sahel is a sub-Saharan area defined between the isohyetal lines of 150mm and 850 mm of rain per year. However, depending on the period, the season and the drought / rain conditions this area moves: hence the definition of the breath of the Sahel. This data represents the minimum and maximum extension of the Sahel area over the last 30 years.