Main navigation
User account menu
Language

Where are the best places to spot the most requested wildlife-watching species? This grid layer presents a richness index of top wildlife watching species/groups, including rhinos, elephants, lions, leopards, buffalos, giraffes, lowland and mountain gorillas, chimpanzees, bonobos, sifakas, ringtails, aye-aye, mouse lemurs and colobus.
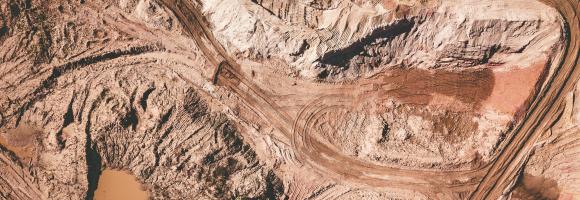
This dataset shows Regional locations and general geologic setting of known deposits of major nonfuel mineral commodities in Africa
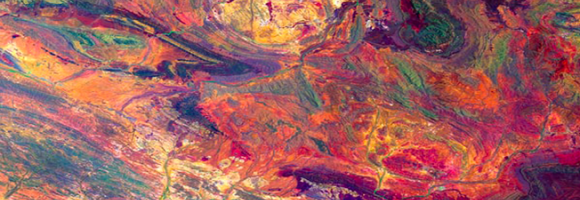
The Africa Topographic Potisiont layer classifies the African landscape (including Madagascar, Comoros Islands, and other coastal Islands near continenal Africa) into uplands and lowlands/depressions at a 100m resolution. Published by the USGS in 2009, this dataset was created for the Africa Terrestrial Ecosystems mapping project. The classification is derived from the Compound Topographic Index (CTI) , which integrates slope (from SRTM elevation data) and flow accumulation (from HydroSHEDS data) to model potential water flow.

The Biodiversity Intactness Index shows the modelled average abundance of originally-present species in a grid cell, as a percentage, relative to their abundance in an intact ecosystem. Originally available for year 2015, the data is now available in a time series covering the period 2000-2015 - here we provide a bi-decade subset of the index.
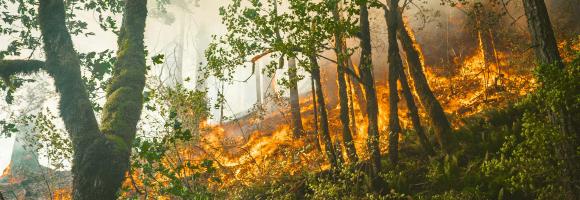
The Copernicus Global Land Service - Burnt Area products depict burn scars, surfaces which have been sufficiently affected by fire to display significant changes in the vegetation cover (destruction of dry material, reduction or loss of green material) and in the ground surface (temporarily darker because of ash). The monthly products are available at global scale in the spatial resolution of 300 m and cover the period from January 2019 to April 2022. The pixel bears the value of the day of the year in which the burn scars were visible while, if selected for mapping in this platform, the dataset shows the burn scars detected in the selected month.
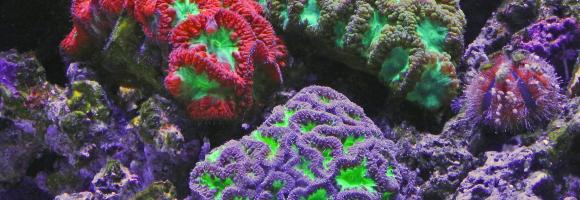
This dataset is an index that estimates the relative value provided by coral reefs that protect coastlines through reduction of wave height and wave energy. The value as of 2014 is modelled as a function of exposed populations and infrastructure that received some level of protection from coastal and barrier reefs, and is described in relative terms, classified by decile (i.e., grouped into the most valuable ten percent of reefs for protection, the second-most valuable tenth of reefs, etc.). It was calculated at 1 kilometre (km) resolution globally, encompassing all countries and territories containing coral reefs.
Poverty affects billions of people around the globe. On a daily basis, they face low wages and substandard health, education, and living standards. Because of this, poverty must be understood and approached as a multidimensional issue. The Multidimensional Poverty Index (MPI) acknowledges that poverty has many faces. The second dimension in the MIP is the Education dimension. This includes years of schooling and child school attendance. This map shows the percentage contribution of the education dimension to overall poverty. The lower percentages are shown in darker blues while the higher percentages are shown as brighter, lighter blues.

This layer provides the Effective Leaf Area Index (LAIe), a critical parameter for modeling evapotranspiration and carbon fluxes between the biosphere and the atmosphere. Monitoring the distribution and seasonal evolution of LAI is essential for assessing vegetation health and ecosystem dynamics across Africa.
The Effective Leaf Area Index is a quantitative measure of the amount of live green leaf material present per unit ground surface. Unlike "True LAI," which represents the total physical leaf area, the Effective LAI is derived from canopy gap fraction measurements and assumes a random distribution of foliage. It is a non-dimensional quantity, typically expressed in units of m²/m².
This dataset is widely utilized in agro-meteorology, biogeochemical modeling, and General Circulation Models (GCMs) to parameterize vegetation cover and its complex interactions with the atmosphere.
This layer is part of the Earth Land Information System (ELIS).
This layer presents the Effective Leaf Area Index (LAIe) Anomalies, representing the deviation of current vegetation density from the historical average. Monitoring the change of LAI is essential for assessing the evolution of the vegetation over Africa.
LAI anomalies are calculated relative to the average values between 2003 and 2010. The dataset captures LAI anomalies every 10 days, reflecting the high variability and rapid changes in African vegetation cover. Increases in temperature and precipitation deficits are the primary drivers for negative anomalies (reduced foliage density). Beyond climatic factors, human activities or animal grazing may also locally impact the state and density of leaves.
This layer is part of the a href="https://fapar.jrc.ec.europa.eu/_www/index.php">Earth Land Information System (ELIS).

The Global Gridded Relative Deprivation Index (GRDI) characterizes the relative levels of multidimensional deprivation and poverty, where a value of 100 represents the highest level of deprivation and a value of 0 the lowest. GRDI is built from sociodemographic and satellite data inputs that were spatially harmonized, indexed, and weighted into six main components to produce the final GRDI layer.
The INFORM Risk Index 2021 is a composite model structured into a hierarchy of dimensions, categories, and components. All scores are normalized on a scale of 0 to 10 (10 being the highest risk).
Below is the clear breakdown of the index's architecture based on your descriptions:
The top-level score representing a country's overall risk of humanitarian crisis. It is used to assign countries into Risk Classes:
This dimension measures the predisposition of a population to be affected by a hazard based on economic, political, and social characteristics.
Sub-Index: Socio-Economic Vulnerability
An aggregate index covering three main components of systemic instability:
Sub-Index: Vulnerable Groups
Captures social groups with limited access to care and heightened susceptibility:
This dimension measures the ability of a country to manage and recover from disasters through its infrastructure and government effort.
Sub-Index: Institutional Capacity
Measures the "soft" infrastructure of a country's disaster management:
Sub-Index: Infrastructure
Measures the "hard" assets and systems available during a crisis:

The International Wealth Index is an asset-based wealth index that runs from 0 (no assets) to 100 (all assets) and is comparable across place and time. The lower the level of the Index, the greater the potential of electricity access to reduce poverty and foster development.


Poverty affects billions of people around the globe. On a daily basis, they face low wages and substandard health, education, and living standards. Because of this, poverty must be understood and approached as a multidimensional issue. The Multidimensional Poverty Index (MPI) acknowledges that poverty has many faces. The third and last dimension in the MPI is the Living Standard dimension. This includes access to electricity, improved sanitation services and safe drinking water, flooring, cooking fuel, and assets ownership. This map shows the percentage contribution of the Living Standards Dimension to the overall poverty index. The lower percentages are shown in darker greens while the higher percentages are shown as brighter, lighter greens.
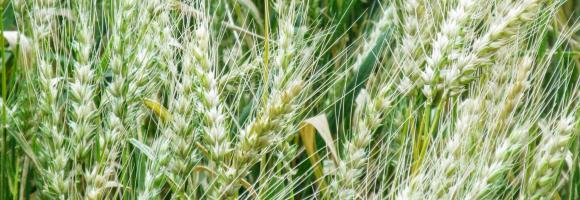
The map is based on Copernicus Global Land Cover data which shows actual land cover (what physically covers land across the globe—forests, grasslands, croplands, lakes, wetlands, built-up area, etc) at 100m x 100m resolution. The land cover data for Africa was overlaid on (high resolution) satellite imagery of Africa, which is then used to determine the land use (by visual interpretation) associated with the various land cover patterns on the Copernicus Global Land Cover map.
Copernicus land cover data offers several advantages: it is of high quality, has a high resolution (100m x 100m), and offers time series satellite imagery. More importantly, the Copernicus Global Land Service is a continuous process and its datasets are updated annually. This means that the Soils4Africa map of agricultural land can be updated every time the land cover data for the new year becomes available (the map is currently based on 2019 data).
The Copernicus dataset already includes the category ‘cropland,’ which by definition is part of agricultural land. The Soils4Africa map broadens the scope of that dataset by infering information on agricultural use and including other kinds of agricultural land use such as grazing pastures and plantations.
When land is mapped as other than ‘cropland'-- like ‘shrubland’ for example-- it is more difficult to interpret and determine whether it is under agricultural use. The Copernicus dataset includes information about ‘fractional cover’-- or the percentage of a particular pixel under a particular kind of land cover (for example, 30% of a 100m x 100m pixel could be forest and 20% could be shrubland). The Soils4Africa map takes into account how fractional cover varies over an area to establish rules for interpreting its land cover data to determine whether it is under agricultural use and for what purpose. These rules were validated by comparing it with ground level information on land use (or land use pattern) for specific areas drawn from the interpretation of satellite imagery from Google Earth.
For example, ground-level observation shows that forest cover upwards of 30% in a given area when matched by shrubland cover of over 30%, is characterized by woody vegetation with a smooth canopy. Therefore, such area is more likely to be under plantations rather than natural forest. Thus, such an area should be counted as agricultural land, even if less than 15% of it is under crops.

The Rule of Law Index, generated by the World Justice Project, illustrates the perceived adherence to the Rule of Law per country. Rule of law is defined here as a durable system of laws, institutions, norms, and community commitment that delivers accountability, just laws, open government, and accessible justice. These principles are measured across eight factors:
The Rule of Law Index aggregate the scores across factors. A high ranking (a low numerical rank) means that perceived adherence to the Rule of Law is higher. 0=weakest, 1=strongest.
This dataset is part of the LEAP-RE project collection. For more information visit https://www.leap-re.eu/
The availability and quantity of observational species occurrence records have greatly increased due to technological advancements and the rise of online portals, such as the Global Biodiversity Information Facility (GBIF), coalescing occurrence records from multiple datasets. Funded by the world's governments, this international network and data infrastructure is aimed at providing anyone, anywhere, open access to data about all types of life on Earth. This map displays all the observations reported to the GBIF from 1600 to present. This knowledge derives from many sources, including everything from museum specimens collected in the 18th and 19th century to geotagged smartphone photos shared by amateur naturalists in recent days and weeks. Individual records are available at https://www.gbif.org
Droughts affect millions of people in the world each year and have long-lasting socioeconomic impacts. They can occur over most parts of the world, even in wet and humid regions, and can profoundly impact agriculture, basic household welfare, tourism, ecosystems and the services they provide. The Standardized Precipitation Index (SPI) is the most commonly used indicator worldwide for detecting and characterizing meteorological droughts, which are prolonged periods of less than average rainfall in a given region. It measures precipitation anomalies at a given location, based on a comparison of observed total precipitation amounts for an accumulation period of interest (in this case, 3 months), with the long-term rainfall record for that period. SPI values below ‒1.0 indicate rainfall deficits (drier than normal – yellow to red), while SPI values above 1.0 indicate excess rainfall (wetter than normal – purple to blue). The lower the SPI, the more intense is the drought. The layer show the SPI-3 from the month second to last and is updated monthly.
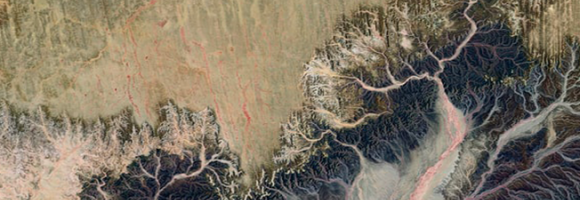
Organisms and non-living elements of the environment such as climate, soil, and water are connected through the movement of nutrients and energy in ecosystems. Ecosystems represent specific areas where organisms and environmental conditions create a network of interactions and are affected by forces such as disturbance (temporary change in environmental conditions that causes a pronounced change) and succession (process of change in the species structure of an ecological community over time). This layer maps the Ecosystems of Africa, based on Africa's climate regions, topography and lithology (bedrock), with a 100m spatial resolution.
This dataset provides a continent-wide, raster-based spatial representation of Earth's surface heat flow across the African tectonic plate for the year 2013, modeled under a historical baseline scenario. The data quantifies the amount of thermal energy moving from the Earth's interior to its surface, with values explicitly expressed in watts per square meter (W/m²). This resource is critical for identifying geothermal potential, understanding tectonic anomalies, and supporting broader geoscientific and energy research.
Sources and ContextThis layer is part of the Geothermal Atlas for Africa developed within the LEAP-RE project
This dataset maps regions across Africa with high geothermal energy exploration potential, identifying areas where further research and investment are most likely to yield significant returns. The mapping represents a synthesis of the Indicator Analysis performed by TNO (Hofstra, 2023), specifically selecting the most and least favorable technical outcomes under the assumption of a clay-poor sandstone (CP) compaction model.
To ensure structural robustness and account for geological uncertainty, the indicator results have been projected onto four distinct geological basin models:
Key Indicators & Methodology
The favorable results displayed in these maps are derived from a multi-criteria evaluation which includes:
This layer is part of the Geothermal Atlas for Africa developed within the LEAP-RE project.
This dataset comprises a collection of shapefiles detailing the geographical locations and attributes of various wells across Africa, with a strong focus on geothermal exploration and assessment. Together, these layers offer a valuable resource for geothermal energy planning, subsurface geological analysis, and infrastructure mapping. The collection includes the following spatial data layers:
These layers are part of the Geothermal Atlas for Africa developed within the LEAP-RE project"
This dataset compiles geophysical models detailing the thickness of the Earth's outer layers, ranging from surface sedimentary basins down to the base of the lithosphere. The collection serves a dual purpose: it provides broad, global baseline data for sediment distribution, while also offering high-resolution, integrated regional models specifically focused on the African plate.
Dataset Contents:
I. Global Baselines
II. African Regional Models
These layers are part of the Geothermal Atlas for Africa developed within the LEAP-RE project
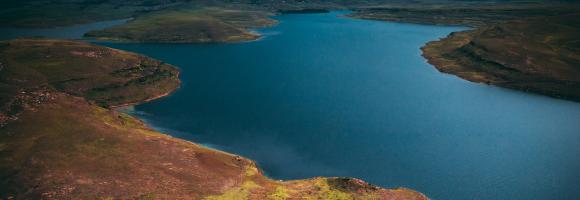
The current version of the GDW database (version 1.0) aims to catalogue all types of anthropogenic instream barriers. While initial mapping efforts prioritize major dams that form reservoirs, as well as run-of-river barriers on larger rivers where more information is readily available, the dataset comprises two distinct but interconnected spatial layers:
This dataset shows the location of hydrocarbon provinces with proven petroleum reserves. This data was compiled as part of the USGS's World Energy Project (WEP).
This dataset is part of the LEAP-RE project collection. For more information visit https://www.leap-re.eu/
Development test dataset: random 0-100 values on the 0.35° Nature Africa grid clipped to the DRC. Not real data.