Main navigation
User account menu
Language

Priority areas are identified using local coefficients estimated through Geographically Weighted Regression (GWR), which measures the spatially varying relationship between access to electricity and four nutrition indicators among children under five: stunting, wasting, severe wasting, and underweight.
The tool highlights locations where the local association between electricity access and the selected nutrition indicator is both negative and statistically significant. In this application, priority areas are further restricted to locations where electricity access is below 80%, ensuring that the results remain relevant for policy intervention.
The identified areas are classified as having strong, moderate, or mild associations according to the magnitude of the local GWR coefficient. This classification helps users determine the appropriate intensity of intervention. The spatially varying coefficients therefore allow users to identify areas where limited electricity access is most strongly associated with poorer nutritional outcomes among children under five, supporting targeted interventions, programme planning, and place-based development strategies.

Percentage of schools in Africa reporting to have no electricity. The lower the education facilities with access to electricity the greater the potential for decentralised renewable energies to improve electricity access in these facilities and thus educational outcomes.

This layer represents the predicted likelihood that a given settlement is electrified, with values ranging from 0 (no electricity) to 1 (fully electrified). The data are derived from the High Resolution Electricity Access (HREA) dataset, which combines satellite observations of night-time lights with population settlement layers to estimate electricity access. Areas with low predicted electrification can help identify where decentralized renewable energy solutions may be most impactful in closing electricity access gaps.
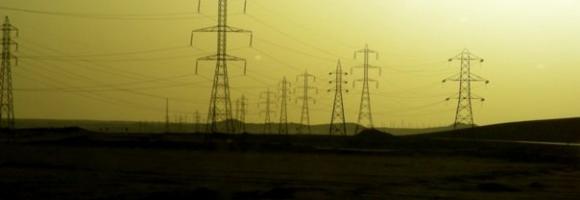
In Sub-Saharan Africa, medium- and low-voltage data are often non-existent, uncompleted, or unavailable. This is a challenge for practitioners working on the electricity access agenda, power sector resilience or climate change adaptation. This layer presents the spatial extent of the existing and planned electricity grid (high, medium, low voltage level) compiled using multiple sources that enumerate elements of the existing transmission and distribution network.

Percentage of healthcare facilities with electricity access in selected countries. Information on electricity access for healthcare facilities has been collected in the electricity access health facility database (EHFDB). The lower the healthcare facilities with access to electricity the greater the potential for decentralised renewable energies to improve electricity access in these facilities and thus healthcare outcomes.

This layer shows the percentage of people with access to any improved sanitation facility, including both piped systems (such as sewer or septic tanks) and non-piped improved options (like ventilated improved pit latrines or composting toilets), in 2017. Improved sanitation is essential for public health, reducing the spread of waterborne diseases and supporting safe and dignified living conditions. Areas with low access highlight the need for expanded basic services and targeted investments in infrastructure.


Côte d'Ivoire and Ghana are the main largest producers of cocoa in the world. However, the cultivation of this crop has led to the loss of vast tracts of forest areas in both countries. Efficient and accurate methods for remotely identifying cocoa farms are essential for the implementation of sustainable cocoa practices and the periodic and effective monitoring of forests. This map, generated using Random Forest image classification, shows the 2019 distribution of cocoa farms in both countries. The estimated area for cocoa is 4.8Mha for Cote d'Ivoire and 2.3Mha for Ghana.
An intact forest landscape (IFL) is a seamless mosaic of forest and naturally treeless ecosystems with no remotely detected signs of human activity and a minimum area of 500 km2. (Potapov et al.2017) Intact forests are complex and diverse ecosystems that if lost, are irreplaceable. Research shows that designating intact forest landscapes as protected areas has proven effective at limiting their fragmentation. Since 2000, around 100 conserved and protected areas were created in intact forests areas in ACP countries, increasing the percentage of IFL protected from 11% in 2000 to 26% in 2020.
Differences in countries in terms of IFL area reduction: Cuba has not experienced any reduction in IFLs and nowadays its intact forests are fully protected by PAs (544sqkm). At the contrary Angola still not has any kind of protection for its IFLs and experienced a reduction of 39,83% of its IFL (1160 sqkm) in country.The reduction of IFL area in ACP countries was higher outside PAs (19%) than within PAs (5%).Madagascar is the country where the reduction of IFL areas was very high inside protected areas (2420 sqkm). The IFL loss inside PAs has been more than 40% between 2000 and 2020. Central African Republic experienced 23% of reduction inside PAs (938,13 sqkm). This layer shows the percentage of IFLs protected by country
| Country | IFL protected 2020 (sqkm) | IFL unprotected 2020 (sqkm) | Percentage of IFL protected 2020 | Percentage of IFL unprotected 2020 |
| Angola | 0.00 | 1752.85 | 0.00 | 100.00 |
| Belize | 3310.17 | 288.36 | 91.99 | 8.01 |
| Cameroon | 19181.16 | 12787.52 | 60.00 | 40.00 |
| Central African Republic | 3070.21 | 656.90 | 82.37 | 17.62 |
| Congo | 67218.88 | 32997.23 | 67.07 | 32.93 |
| Cote d'Ivoire | 3759.21 | 1.27 | 99.97 | 0.03 |
| Cuba | 544.02 | 0.00 | 100.00 | 0.00 |
| Democratic Republic of the Congo | 131588.22 | 465687.18 | 22.03 | 77.97 |
| Dominican Republic | 553.86 | 11.03 | 98.05 | 1.95 |
| Equatorial Guinea | 1549.39 | 555.44 | 73.61 | 26.39 |
| Ethiopia | 0 | 3233.7 | 0 | 100 |
| Gabon | 22692.90 | 53598.80 | 29.74 | 70.26 |
| Guyana | 15545.93 | 101781.93 | 13.25 | 86.75 |
| Liberia | 1573.69 | 1306.95 | 54.63 | 45.37 |
| Madagascar | 9931.34 | 867.74 | 91.96 | 8.04 |
| Nigeria | 2211.75 | 204.39 | 91.54 | 8.46 |
| Papua New Guinea | 5863.48 | 121258.17 | 4.61 | 95.39 |
| Samoa | 93.13 | 550.03 | 14.48 | 85.52 |
| Solomon Islands | 60.11 | 2569.93 | 2.29 | 97.71 |
| Suriname | 17304.85 | 75269.36 | 18.69 | 81.31 |
| Uganda | 945.21 | 16.84 | 98.25 | 1.75 |
| United Republic of Tanzania | 3627.46 | 168.85 | 95.55 | 4.45 |
| Vanuatu | 13.24 | 675.08 | 1.92 | 98.08 |
Analysis performed by Simona Lippi

Despite a high total population, most parts of the African continent are sparsely populated, with almost 60% living in non-urban areas. Diesel generators have long been the traditional solution to decentralized electrification needs. For off-grid applications, they present lower up-front capital costs per kilowatt installed; however, the dramatic increase of fuel costs in recent years and the cost of transport to remote areas greatly diminish the low capital cost advantage of the diesel option. Even in the cases when the initial investments were subsidized, the high yearly fuel cost are born by the users which often results in early termination of its use. The map shows the spatial variance of the electricity costs per kWh delivered by an off-grid diesel generator.


The INFORM Risk Index 2021 is a composite model structured into a hierarchy of dimensions, categories, and components. All scores are normalized on a scale of 0 to 10 (10 being the highest risk).
Below is the clear breakdown of the index's architecture based on your descriptions:
The top-level score representing a country's overall risk of humanitarian crisis. It is used to assign countries into Risk Classes:
This dimension measures the predisposition of a population to be affected by a hazard based on economic, political, and social characteristics.
Sub-Index: Socio-Economic Vulnerability
An aggregate index covering three main components of systemic instability:
Sub-Index: Vulnerable Groups
Captures social groups with limited access to care and heightened susceptibility:
This dimension measures the ability of a country to manage and recover from disasters through its infrastructure and government effort.
Sub-Index: Institutional Capacity
Measures the "soft" infrastructure of a country's disaster management:
Sub-Index: Infrastructure
Measures the "hard" assets and systems available during a crisis:
In 2020, a group of researchers carried out analysis to examine the importance of Indigenous Peoples’ lands for preserving Intact Forest Landscapes.(Fa et al.2020)They used geospatial data on the extent of Indigenous Peoples’ lands reported by Garnett et al. (2018), and Geospatial data for IFLs were sourced from the Intact Forest Landscapes website (www.intactforests.org) for the years 2000, 2013, and 2016 (Potapov et al. 2017)In the paper they have shown that the proportion of Indigenous Peoples’ lands mapped as IFLs was considerably higher (10.9%) than the proportion of other lands (defined here as all land outside Indigenous Peoples’ lands) mapped as IFLs (6.8%).
In this map we reported the percentage of Intact Forest Lansdcapes reduction in Indigenous People Lands for the period 2000-2016. IN the table we reported also the percentage of IFLs reduction in other lands. To explore more IFLs conservation strategies for African, Caribbean and Pacific countries you can check BIOPAMA Geonode Layers
Sources:
Fa JE, Watson JE, Leiper I, Potapov P, Evans TD, Burgess ND, Molnár Z, Fernández‐Llamazares Á, Duncan T, Wang S, Austin BJ. Importance of Indigenous Peoples’ lands for the conservation of Intact Forest Landscapes. Frontiers in Ecology and the Environment. 2020 Apr;18(3):135-4

Adult literacy rate is the percentage of people ages 15 and above who can both read and write with understanding a short simple statement about their everyday life. Literacy statistics for most countries cover the population ages 15 and older, but some include younger ages or are confined to age ranges that tend to inflate literacy rates. The youth literacy rate for ages 15-24 reflects recent progress in education. It measures the accumulated outcomes of primary education over the previous 10 years or so by indicating the proportion of the population who have passed through the primary education system and acquired basic literacy and numeracy skills.
Number of maternal deaths during a given time period per 100 000 live births during the same time period. The lower the number of healthcare facilities with access to electricity the greater the potential for decentralised renewable energies to reduce maternal mortality.
From the new available dataset in GFW on tree cover change between 2000 and 2020, here we are displaying the net change in tree cover by percent for country.The net change in tree cover corresponds to the area of gross gain minus the area of gross loss to show the overall change (negative or positive). The attribute table provides also statistics on net change in tree cover such stable forest or disturbed forest(in hectars).
This dataset is accessed through Global Forest Watch on 04/10/2022. www.globalforestwatch.org.
Potapov, P., Hansen, M.C., Pickens, A., Hernandez-Serna, A., Tyukavina, A., Turubanova, S., Zalles, V., Li, X., Khan, A., Stolle, F., Harris, N., Song, X-P., Baggett, A., Kommareddy, I., and Kommareddy, A. 2022. The Global 2000-2020 Land Cover and Land Use Change Dataset Derived From the Landsat Archive: First Results. Frontiers in Remote Sensing, 13, April 2022. https://doi.org/10.3389/frsen.2022.856903; summarized by administrative area at WRI

Net official development assistance (ODA) is government aid designed to promote the economic development and welfare of developing countries. Aid may be provided bilaterally, from donor to recipient, or channelled through a multilateral development agency such as the United Nations or the World Bank. Net official aid (OA) refers to aid flows from official donors to more advanced (developing) countries and territories. Official aid is provided under terms and conditions similar to those for ODA. This map shows the aggregated figure (sum of ODA and OA) for African countries. Data are in current U.S. dollars.

This layer shows the percentage of children under 6 months who are exclusively breastfed, meaning they receive only breast milk without any additional food or drink. Exclusive breastfeeding is a key determinant of child survival, growth, and development.
Priority areas are identified using local coefficients estimated through Geographically Weighted Regression (GWR), which measures the spatially varying relationship between access to electricity and education using the indicator of percentage of population with secondary education .
The tool highlights locations where the local association between electricity access and the selected nutrition indicator is both negative and statistically significant. In this application, priority areas are further restricted to locations where electricity access is below 80%, ensuring that the results remain relevant for policy intervention.
The identified areas are classified as having strong, moderate, or mild associations according to the magnitude of the local GWR coefficient. This classification helps users determine the appropriate intensity of intervention. The spatially varying coefficients therefore allow users to identify areas where limited electricity access is most strongly associated with higher education, supporting targeted interventions, programme planning, and place-based development strategies.
Priority areas are identified using local coefficients estimated through Geographically Weighted Regression (GWR), which measures the spatially varying relationship between access to electricity and gender using the indicator of proportion of women with secondary school. The tool highlights locations where the local association between electricity access and the selected nutrition indicator is both negative and statistically significant. In this application, priority areas are further restricted to locations where electricity access is below 80%, ensuring that the results remain relevant for policy intervention. The identified areas are classified as having strong, moderate, or mild associations according to the magnitude of the local GWR coefficient. This classification helps users determine the appropriate intensity of intervention. The spatially varying coefficients therefore allow users to identify areas where limited electricity access is most strongly associated with lower proportion of women at secondary school, supporting targeted interventions, programme planning, and place-based development strategies.
Priority areas are identified using local coefficients estimated through Geographically Weighted Regression (GWR), which measures the spatially varying relationship between access to electricity and health using the indicator of under-5 mortality.
The tool highlights locations where the local association between electricity access and the selected nutrition indicator is both negative and statistically significant. In this application, priority areas are further restricted to locations where electricity access is below 80%, ensuring that the results remain relevant for policy intervention.
The identified areas are classified as having strong, moderate, or mild associations according to the magnitude of the local GWR coefficient. This classification helps users determine the appropriate intensity of intervention. The spatially varying coefficients therefore allow users to identify areas where limited electricity access is most strongly associated with higher mortality among children under five, supporting targeted interventions, programme planning, and place-based development strategies.
Priority areas are identified using local coefficients estimated through Geographically Weighted Regression (GWR), which measures the spatially varying relationship between access to sanitation infrastructure and health using the indicator of under 5 mortality. The tool highlights locations where the local association between sanitation access and the selected gender indicator is both negative and statistically significant. The identified areas are classified as having strong, moderate, or mild associations according to the magnitude of the local GWR coefficient. This classification helps users determine the appropriate intensity of intervention. The spatially varying coefficients therefore allow users to identify areas where limited sanitation access is most strongly associated with higher child mortality, supporting targeted interventions, programme planning, and place-based development strategies.

This layer shows the estimated number of deaths per 1,000 live births among children under 5 years of age (in 2017) — a key indicator of child survival and overall health system performance. High under-5 mortality rates often reflect limited access to essential health services, clean water, sanitation, and adequate nutrition. Expanding decentralized systems can play a key role in improving child survival outcomes in underserved areas.
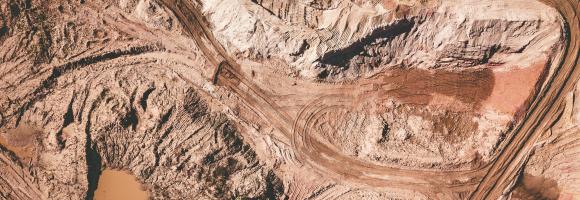
This dataset shows Regional locations and general geologic setting of known deposits of major nonfuel mineral commodities in Africa

Distance from existing or planned electric grid lines (LV; MV; HV).
Unit: km


This dataset compiles geophysical models detailing the thickness of the Earth's outer layers, ranging from surface sedimentary basins down to the base of the lithosphere. The collection serves a dual purpose: it provides broad, global baseline data for sediment distribution, while also offering high-resolution, integrated regional models specifically focused on the African plate.
Dataset Contents:
I. Global Baselines
II. African Regional Models
These layers are part of the Geothermal Atlas for Africa developed within the LEAP-RE project
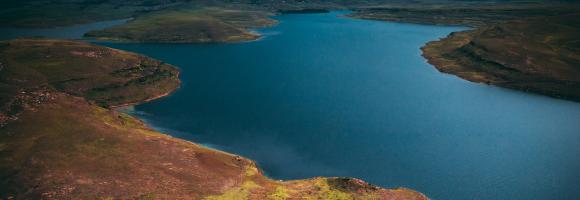
The current version of the GDW database (version 1.0) aims to catalogue all types of anthropogenic instream barriers. While initial mapping efforts prioritize major dams that form reservoirs, as well as run-of-river barriers on larger rivers where more information is readily available, the dataset comprises two distinct but interconnected spatial layers:
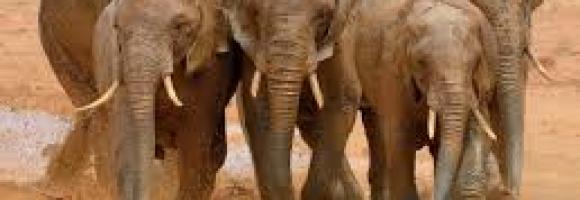
<p>This spatial dataset contains the geographic boundaries and ecological evaluations of 45 Key Landscapes for Conservation and Development (KLCDs) across Sub-Saharan Africa. Building on the <a href="https://africa-knowledge-platform.ec.europa.eu/dataset/key-landscapes-c…; Key Landscapes for Conservation (KLCs) </a> identified in the EU report <a href="https://op.europa.eu/sl/publication-detail/-/publication/d76ac7eb-bc4a-…;“Larger than elephants”</a>, the NaturAfrica initiative is rolled out across these key biodiversity and development landscapes.</p>
<p>NaturAfrica's efforts are concentrated on ‘mega-landscapes’—biogeographical regions identified as crucial for both conservation and development. These regions encompass:</p>
<ul>
<li>The forest ecosystems of the Congo Basin;</li>
<li>Landscapes of transhumance pastoralists in North Cameroon, the Central African Republic, and Chad;</li>
<li>Guinean forests of West Africa;</li>
<li>Savannahs in the Sudano-Sahelian zone of West Africa;</li>
<li>Savannahs and watersheds of the East Africa rift;</li>
<li>Transfrontier conservation areas of Southern Africa.</li>
</ul>
<p>The layer was developed to support the prioritization of intervention areas for the second phase of this initiative, which combines conservation with sustainable job creation. It provides a spatially explicit characterization of ecological value across these landscapes, evaluated and attributed based on five core ecological and environmental dimensions:</p>
<ul>
<li><span class="label">Threatened Species Richness:</span> Concentration and diversity of threatened species.</li>
<li><span class="label">Species Endemicity:</span> Presence of endemic species unique to the specific geographic region.</li>
<li><span class="label">Ecosystem Integrity:</span> The integrity of protected and conserved areas, accounting for degrees of human modification and habitat fragmentation.</li>
<li><span class="label">Ecological Connectivity:</span> The degree of connectivity and spatial linkages between protected and conserved areas.</li>
<li><span class="label">Ecosystem Services:</span> Provisioning and regulating services, with a specific focus on carbon storage and water services.</li>
</ul>
<strong>Purpose</strong>
<p>The layer was created to inform the EC Directorate General for International Partnerships (DG INTPA) and policymakers in selecting and prioritizing funding intervention areas based on specific targets (e.g., species conservation, connectivity, or water security) within different biogeographical regions. It serves as a spatial decision-support tool to align with the European Green Deal and the EU Biodiversity Strategy for 2030.</p>
<strong>Geographic Extent</strong>
<ul>
<li><span class="label">Region:</span> Sub-Saharan Africa</li>
<li><span class="label">Coverage:</span> 45 distinct Key Landscapes for Conservation and Development (KLCDs)</li>
</ul>
<strong>Keywords</strong>
<ul>
<li><span class="label">Thematic:</span> Biodiversity Conservation, NaturAfrica, Ecosystem Services, Protected Areas, Habitat Connectivity, Species Endemicity, European Green Deal, Ecosystem Integrity, Transfrontier Conservation, Mega-landscapes.</li>
<li><span class="label">Spatial:</span> Sub-Saharan Africa, Congo Basin, West Africa, East Africa, Southern Africa, Sudano-Sahelian zone.</li>
</ul>
<strong>Lineage / Data Source</strong>
<p>This dataset is derived from the <a href="https://publications.jrc.ec.europa.eu/repository/handle/JRC145021"> technical assessment conducted for the European Commission Knowledge Centre for Biodiversity (KCBD) </a>.</p>

Chlorophyll-a concentrations (Chla) are an indicator of phytoplankton abundance and biomass in open waters. They can be an effective measure of trophic status and are commonly used to measure water quality. This layer compares the Chla value from the last full month with the long-term mean Chla. A positive anomaly (warm colours) means the monthly Chla is higher than the long-term average for that month; a negative anomaly (cool colours) means it is lower than the average.

Priority areas are identified using local coefficients estimated through Geographically Weighted Regression (GWR), which measures the spatially varying relationship between access to piped water and four nutrition indicators among children under five: stunting, wasting, severe wasting, and underweight.
The tool highlights locations where the local association between piped water access and the selected nutrition indicator is both negative and statistically significant. In this application, priority areas are further restricted to locations where piped water access is below 80%, ensuring that the results remain relevant for policy intervention.
The identified areas are classified as having strong, moderate, or mild associations according to the magnitude of the local GWR coefficient. This classification helps users determine the appropriate intensity of intervention. The spatially varying coefficients therefore allow users to identify areas where limited piped water access is most strongly associated with poorer nutritional outcomes among children under five, supporting targeted interventions, programme planning, and place-based development strategies.
Priority areas are identified using local coefficients estimated through Geographically Weighted Regression (GWR), which measures the spatially varying relationship between access to water infrastructure and health using the indicator of under 5 mortality. The tool highlights locations where the local association between access to piped water and the selected health indicator is both negative and statistically significant. The identified areas are classified as having strong, moderate, or mild associations according to the magnitude of the local GWR coefficient. This classification helps users determine the appropriate intensity of intervention. The spatially varying coefficients therefore allow users to identify areas where limited access to piped water is most strongly associated with higher child mortality, supporting targeted interventions, programme planning, and place-based development strategies.