The INFORM Risk Index 2021 is a composite model structured into a hierarchy of dimensions, categories, and components. All scores are normalized on a scale of 0 to 10 (10 being the highest risk).
Below is the clear breakdown of the index's architecture based on your descriptions:
The Composite Index
The top-level score representing a country's overall risk of humanitarian crisis. It is used to assign countries into Risk Classes:
Low: ≤3.5
Medium: 3.5−5.0
High: 5.0−6.5
Very High: ≥6.5
Dimension: Vulnerability
This dimension measures the predisposition of a population to be affected by a hazard based on economic, political, and social characteristics.
Sub-Index: Socio-Economic Vulnerability
An aggregate index covering three main components of systemic instability:
Development Deprivation: Measures poverty using the Human Development Index (HDI) and Multidimensional Poverty Index (MPI).
Inequality: Captures the dispersion of human development, including the Gender Inequality Index and the Gini Coefficient.
Aid Dependency: Measures economic instability through reliance on public aid, development assistance, and remittances.
Sub-Index: Vulnerable Groups
Captures social groups with limited access to care and heightened susceptibility:
Uprooted People: Tracks refugees, IDPs, and returnees.
Children Under 5: Specifically monitors child malnutrition and mortality rates.
Recent Shocks: Factors in populations already affected by natural disasters in the last 3 years.
Food Security: Captures trends in chronic hunger and nutritional balance.
Health Conditions: Monitors the prevalence of pandemics (HIV, TB, Malaria) and neglected tropical diseases.
Dimension: Lack of Coping Capacity
This dimension measures the ability of a country to manage and recover from disasters through its infrastructure and government effort.
Sub-Index: Institutional Capacity
Measures the "soft" infrastructure of a country's disaster management:
Governance: Captures government effectiveness, resilience-building, and political integrity (lack of corruption).
DRR Implementation: Quantifies how well Disaster Risk Reduction activities are actually put into practice.
Sub-Index: Infrastructure
Measures the "hard" assets and systems available during a crisis:
Communication: Evaluates the efficiency of early warning dissemination and the literacy/education of the recipients.
Physical Connectivity: Assesses the accessibility of transport and the quality/availability of water and sanitation services.
Access to Healthcare: Captures health system strength, including physician density and maternal/infant health services.
The IUCN IMMA layer identifies specific habitat areas crucial for one or more marine mammal species, which may be suitable for conservation through delineation and management. IMMAs represent regions that could benefit from targeted protection and/or monitoring. They serve as a marine mammal data layer highlighting important biodiversity, and potentially ecosystem health, which can be prioritized for protection and management by governments, intergovernmental organizations, conservation groups, and the public.
Critical natural assets are defined as the natural and semi-natural terrestrial and aquatic ecosystems required to maintain 12 of nature’s ‘local’ contributions to people (local NCP) in the ocean (blue). 12 Local NCP for key benefits like security in food, water, hazards, material and culture. as follows: for food, pollinator habitat sufficiency ofr pollination dependent crop production, fodder production for livestock, wild riverine and marine fish catch ; for water, water quality regulation, via sediment retention and nutrient retention; for natural hazards, flood risk reduction and coastal risk reduction. For materials, timber production, fuelwood production and access to nature. For cultural benefits, coral reef tourism and access to nature for recreation or other uses. Criticality of the natural assets was defined on the basis of the highest value areas across all NCPs, the magnitude of benefits and the number of beneficiaries. Cropland, urban areas, bare areas and permanent snow and ice are excluded from the analysis.
The Marine Ecoregions of the World is a global system to classify the oceans, helping to plan and prioritise marine conservation measures. How much are marine areas are protected at ecoregion level? For each African marine ecoregion, this map shows the percentage covered by protected areas.
Droughts affect millions of people in the world each year and have long-lasting socioeconomic impacts. They can occur over most parts of the world, even in wet and humid regions, and can profoundly impact agriculture, basic household welfare, tourism, ecosystems and the services they provide. The Risk of Drought Impact for Agriculture (RDrI-Agri) is a categorized risk index, indicating the probability of having impacts from a drought, with particular focus on vegetation. Higher risk (in red) means that the areas affected will be the most likely to report impacts due to droughts. It is updated every ten days.
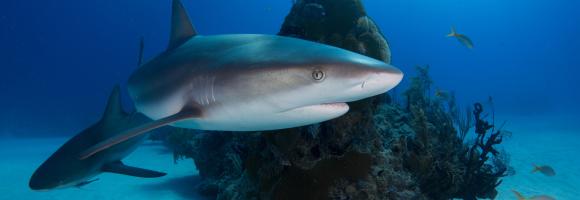
The global capture fisheries has increased over the last 50 years as the consumption of seafood has doubled.This has increased pressure on fish stocks across the world. According to the State of World Fishery and Aquaculture 2020(FAO), the global capture fisheries production rose 14% from 1990 to 2018 and in 2018 it reached 96.4million tonnes. Here we show how much wild fish African countries caught in their EEZ in the last ten years (tonnes). In the attribute table you can find how much of the threatened marine fish species had be legally caught