Main navigation
User account menu
Language

This layer provides estimates of the percentage of children aged 2 to 10 years (PfPR2–10) with detectable Plasmodium falciparum parasites in 2022. The estimates are generated using geostatistical models based on point prevalence surveys, routine surveillance data, and a wide range of geospatial covariates representing mosquito habitat and environmental conditions. The data are available annually from 2000 onward, covering all malaria-endemic countries, at a spatial resolution of 5 × 5 km.
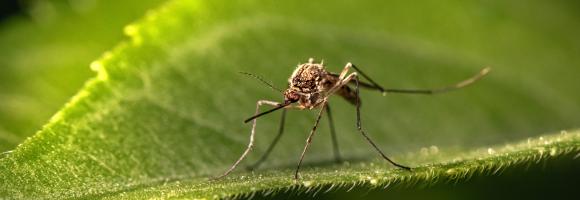
Malaria, a life-threatening disease transmitted by mosquitoes, affects millions of people worldwide. Treatment and prevention efforts such as insecticide-treated mosquito nets and rapid diagnostic tests significantly decreased the number of malaria cases in Africa. This layer displays the change in malaria rates (%) from 2000 to 2015 among children in Sub-Saharan Africa.

Malaria, a life-threatening disease transmitted by mosquitoes, affects millions of people worldwide. This layer highlights malaria rates among children age 2 to 10 in Sub-Saharan Africa in 2015.

Priority areas are identified using local coefficients estimated through Geographically Weighted Regression (GWR), which measures the spatially varying relationship between access to electricity and four nutrition indicators among children under five: stunting, wasting, severe wasting, and underweight.
The tool highlights locations where the local association between electricity access and the selected nutrition indicator is both negative and statistically significant. In this application, priority areas are further restricted to locations where electricity access is below 80%, ensuring that the results remain relevant for policy intervention.
The identified areas are classified as having strong, moderate, or mild associations according to the magnitude of the local GWR coefficient. This classification helps users determine the appropriate intensity of intervention. The spatially varying coefficients therefore allow users to identify areas where limited electricity access is most strongly associated with poorer nutritional outcomes among children under five, supporting targeted interventions, programme planning, and place-based development strategies.

Priority areas are identified using local coefficients estimated through Geographically Weighted Regression (GWR), which measures the spatially varying relationship between access to sanitation and four nutrition indicators among children under five: stunting, wasting, severe wasting, and underweight.
The tool highlights locations where the local association between sanitation access and the selected nutrition indicator is both negative and statistically significant. In this application, priority areas are further restricted to locations where sanitation access is below 80%, ensuring that the results remain relevant for policy intervention.
The identified areas are classified as having strong, moderate, or mild associations according to the magnitude of the local GWR coefficient. This classification helps users determine the appropriate intensity of intervention. The spatially varying coefficients therefore allow users to identify areas where limited sanitation access is most strongly associated with poorer child nutrition outcomes, supporting targeted interventions, programme planning and place-based development strategies.

This layer shows the percentage of children under 5 experiencing severe wasting (in 2019) — the most critical form of acute malnutrition. These children face a significantly higher risk of mortality and require immediate therapeutic support. This indicator helps prioritize emergency nutrition interventions and monitor high-risk areas in need of health and food system strengthening.

This layer shows the percentage of stunting among children under 5 years of age, a form of chronic undernutrition reflected in low height-for-age. Stunting can result from prolonged food insecurity, poor maternal health, or inadequate early childhood care. Areas with high stunting rates indicate long-term development challenges and can help guide interventions aimed at improving nutrition, health services, and water and sanitation infrastructure.

This layer shows the percentage of children under 5 years of age (in 2019) who are underweight, based on low weight-for-age. Underweight is a composite indicator capturing both chronic and acute undernutrition. It is useful for identifying vulnerable populations and informing multisectoral strategies to improve child health, food access, and caregiving practices.
This layer shows the prevalence of wasting among children under 5 years of age (in 2019), a sign of acute undernutrition indicated by low weight-for-height. Wasting reflects recent and severe weight loss, often caused by food shortage, infection, or crisis conditions. Mapping areas with high wasting rates can help target urgent humanitarian and nutrition assistance.

Priority areas are identified using local coefficients estimated through Geographically Weighted Regression (GWR), which measures the spatially varying relationship between access to piped water and four nutrition indicators among children under five: stunting, wasting, severe wasting, and underweight.
The tool highlights locations where the local association between piped water access and the selected nutrition indicator is both negative and statistically significant. In this application, priority areas are further restricted to locations where piped water access is below 80%, ensuring that the results remain relevant for policy intervention.
The identified areas are classified as having strong, moderate, or mild associations according to the magnitude of the local GWR coefficient. This classification helps users determine the appropriate intensity of intervention. The spatially varying coefficients therefore allow users to identify areas where limited piped water access is most strongly associated with poorer nutritional outcomes among children under five, supporting targeted interventions, programme planning, and place-based development strategies.

Map showing the average continental surface temperature of the year 2022. This map was created by interpolating raw monthly satellite data to fill holes in the grids and subsequently adding and averaging the monthly surface temperatures of the year 2022. The data is clipped to only show the African continental region. The raw data is collected during the daytime by the Moderate Resolution Imaging Spectroradiometer (MODIS), an instrument on NASA's Terra and Aqua satellites. Please note that the type of "surface" MODIS measures varies as a function of location. In some places, the measurement represents the skin temperature of the bare land surface. In other places, the temperature represents the skin temperature of whatever is on the land-including snow and ice, or the leafy canopy of forests and crop fields, or human-made structures such as pavement and building rooftops.
Values are expressed in °C.
This dataset is part of the LEAP-RE project collection. For more information visit https://www.leap-re.eu/

Percentage of children 24-35 months who had received all age appropriate vaccinations. The lower the number of vaccinated children, the more beneficial decentralised renewable energy solutions may be in providing electricity to store vaccines in proper refrigerators.

Percentage of cohort of young people three to five years older than the intended age for the last grade of upper secondary level of education who have completed that level of education. This indicator measures the potential impact of electricity on youth education, that represents a crucial pillar for the development of a country.

Percentage of children aged 6-8 that currently attends, or in the current school year attended, school. This indicator measures the potential educational impact of bringing electricity to schools; therefore, the impact of binging electricity will be higher where the educational attendance is low.

This dataset provides fixed broadband performance metrics in zoom level 16 web Mercator tiles (approximately 610.8 meters by 610.8 meters at the equator). Download speed is collected via the Speedtest by Ookla applications for Android and iOS and averaged for each tile. Measurements are filtered to results containing GPS-quality location accuracy. Speedtest data is used today by commercial fixed network operators around the world to inform network buildout, improve global Internet quality, and increase Internet accessibility. This data can be used for rural and urban connectivity development, to help make the internet better, faster, and more accessible for everyone.
This dataset provides fixed broadband performance metrics in zoom level 16 web Mercator tiles (approximately 610.8 meters by 610.8 meters at the equator). Download speed is collected via the Speedtest by Ookla applications for Android and iOS and averaged for each tile. Measurements are filtered to results containing GPS-quality location accuracy. Speedtest data is used today by commercial fixed network operators around the world to inform network buildout, improve global Internet quality, and increase Internet accessibility. This data can be used for rural and urban connectivity development, to help make the internet better, faster, and more accessible for everyone.
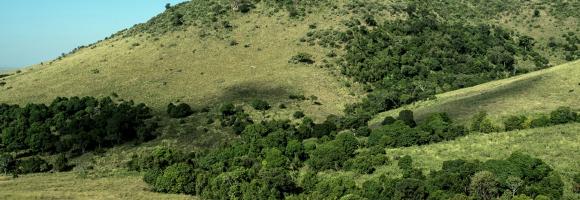
The EC JRC global map of forest cover provides a spatially explicit representation of forest presence and absence for the year 2020 at 10m spatial resolution.
The year 2020 corresponds to the cut-off date of the Regulation from the European Union "on the making available on the Union market and the export from the Union of certain commodities and products associated with deforestation and forest degradation" (EUDR, Regulation (EU) 2023/1115). In the context of the EUDR, the global forest cover map can be used as a non-mandatory, non-exclusive, and not legally binding source of information. Further information about the map and its use can be found on the EU Observatory on Deforestation and Forest Degradation (EUFO) in the section on Frequently Asked Questions.
Forest means land spanning more than 0.5 hectares with trees higher than 5 meters and a canopy cover of more than 10%, or trees able to reach those thresholds in situ, excluding land that is predominantly under agricultural or urban land use. Agricultural use means the use of land for the purpose of agriculture, including for agricultural plantations (i.e. tree stands in agricultural production systems such as fruit tree plantations, oil palm plantations, olive orchards and agroforestry systems) and set- aside agricultural areas, and for rearing livestock. All plantations of relevant commodities other than wood, that is cattle, cocoa, coffee, oil palm, rubber, soya, are excluded from the forest definition.
The global map of forest cover was created by combining available global datasets (wall-to-wall or global in their scope) on tree cover, tree height, land cover and land use into a single harmonized globally-consistent representation of where forests existed in 2020.
The workflow consisted in first mapping the global maximum extent of tree cover circa the year 2020 from the combination of ESA World Cover 2020 and 2021, WRI Tropical Tree Cover 2020, UMD Global land cover and land use 2019, Global Mangrove Watch 2020, and JRC Tropical Moist Forest 2020 datasets. In the second step, a series of overlays and decision rules were applied to reduce this maximum extent of tree cover and align it with the Forest definition using datasets covering cropland and commodity expansion (ESA World Cereal, UMD Global land cover and land use 2019, UMD Global Cropland Expansion, High-resolution global map of smallholder and industrial oil palm plantations, and WRI Spatial Database of Planted Trees), land use change (UMD global forest cover loss, JRC Tropical Moist Forest, IIASA Global Forest Management), built-up (JRC Global Human Settlement), and water (JRC Global Surface Water).
The detailed mapping approach will be described in a separate technical report expected to be released by March 2024. The accuracy of this map has not been yet assessed but will be reported as soon as available.
Please also refer to the list of known issues and to the JRC Data Catalogue entry.

Adult literacy rate is the percentage of people ages 15 and above who can both read and write with understanding a short simple statement about their everyday life. Literacy statistics for most countries cover the population ages 15 and older, but some include younger ages or are confined to age ranges that tend to inflate literacy rates. The youth literacy rate for ages 15-24 reflects recent progress in education. It measures the accumulated outcomes of primary education over the previous 10 years or so by indicating the proportion of the population who have passed through the primary education system and acquired basic literacy and numeracy skills.
This dataset provides mobile (cellular) network performance metrics in zoom level 16 web Mercator tiles (approximately 610.8 meters by 610.8 meters at the equator). Download speed is collected via the Speedtest by Ookla applications for Android and iOS and averaged for each tile. Measurements are filtered to results containing GPS-quality location accuracy. Speedtest data is used today by commercial mobile network operators around the world to inform network buildout, improve global Internet quality, and increase Internet accessibility. This data can be used for rural and urban connectivity development, to help make the internet better, faster, and more accessible for everyone.
This dataset provides mobile (cellular) network performance metrics in zoom level 16 web Mercator tiles (approximately 610.8 meters by 610.8 meters at the equator). Download speed is collected via the Speedtest by Ookla applications for Android and iOS and averaged for each tile. Measurements are filtered to results containing GPS-quality location accuracy. Speedtest data is used today by commercial mobile network operators around the world to inform network buildout, improve global Internet quality, and increase Internet accessibility. This data can be used for rural and urban connectivity development, to help make the internet better, faster, and more accessible for everyone.
This dataset compiles global and regional models of the Mohorovičić discontinuity (Moho) depth from 2019 to 2022, providing key insights into crustal thickness and lithospheric boundaries. All layer values are expressed in kilometers (km). It includes the Moho Depth (Finger et al., 2022) map, which details the boundary derived from S-wave seismic tomography data, alongside its corresponding Moho Depth Uncertainty layer to highlight spatial confidence and data reliability. Additionally, it features the Global Moho Depth (Szwillus et al., 2019) map, derived using a nonstationary kriging algorithm (Risser & Calder, 2017), which serves as an excellent comparative baseline for structural, geophysical, and tectonic analysis.
These layers are part of the Geothermal Atlas for Africa developed within the LEAP-RE project

This layer shows the percentage of children under 6 months who are exclusively breastfed, meaning they receive only breast milk without any additional food or drink. Exclusive breastfeeding is a key determinant of child survival, growth, and development.

Percentage of children in a school attendance age (approximately 3-17 years old depending on the country) that have internet connection at home. Also in this case the indicator relates to the potential educational impact of electrification on children and young people.

Tropical moist forests have a huge environmental value. They play an important role in biodiversity conservation, terrestrial carbon cycle, hydrological regimes, indigenous population subsistence and human health (1-5). They are increasingly recognized as an essential element of any strategy to mitigate climate change. Deforestation, and degradation compromise the functioning of tropical forests as an ecosystem, lead to biodiversity loss and reduced carbon storage capacity. Deforestation and fragmentation are increasing the risk of virus disease outbreaks. This map shows where deforestation occurred in the last three decades (between 1982 and 2020) and the year when the forest cover has been deforested for the first time (followed or not by a regrowth).
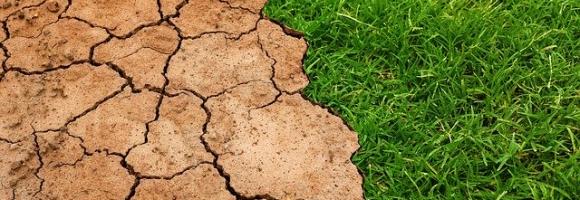
Tropical moist forests have a huge environmental value. They play an important role in biodiversity conservation, terrestrial carbon cycle, hydrological regimes, indigenous population subsistence and human health (1-5). They are increasingly recognized as an essential element of any strategy to mitigate climate change. Deforestation, and degradation compromise the functioning of tropical forests as an ecosystem, lead to biodiversity loss and reduced carbon storage capacity. Deforestation and fragmentation are increasing the risk of virus disease outbreaks. This map shows where degradation occurred in the last three decades (between 1982 and 2020) and the year when the forest has been degraded for the first time (and remained degraded up to 2020).
This dataset provides estimates of the total number of under-5 children per grid cell, for Uganda. The data come from the WorldPop R2025A, version v1 release. The dataset is available in GeoTIFF format at a spatial resolution of 30 arc-seconds (approximately 1 km at the equator). All layers use the WGS84 Geographic Coordinate System.

Prevalence of underweight (weight-for-age <-2 standard deviation from the median of the World Health Organization (WHO) Child Growth Standards) among children under 5 years of age. Survey estimates are based on standardized methodology using the WHO Child Growth Standards. Global and regional estimates are based on methodology outlined in UNICEF-WHO-The World Bank: Joint child malnutrition estimates - Levels and trends (UNICEF/WHO/WB 2012).

The African Development Corridors Database (ADCD) is a comprehensive, georeferenced database detailing 79 ongoing and planned investment corridors across Africa, synthesizing data on 184 specific infrastructure projects (railways, ports, pipelines, airports, techno-cities, and industrial parks). Its purpose is to allow for critical assessment of the spatial and temporal impacts of massive infrastructure investments to maximize development opportunities and support the UN Sustainable Development Goals and AU Agenda 2063. The database includes 22 interlinked tabular and spatial attributes with provided sources, which is expected to improve coordination, efficiency, strategic planning, transparency, and impact assessments for governments, investment banks, practitioners, and conservationists, among other stakeholders.
This dataset provides a continent-wide, raster-based spatial representation of Earth's surface heat flow across the African tectonic plate for the year 2013, modeled under a historical baseline scenario. The data quantifies the amount of thermal energy moving from the Earth's interior to its surface, with values explicitly expressed in watts per square meter (W/m²). This resource is critical for identifying geothermal potential, understanding tectonic anomalies, and supporting broader geoscientific and energy research.
Sources and ContextThis layer is part of the Geothermal Atlas for Africa developed within the LEAP-RE project

The INFORM Risk Index 2021 is a composite model structured into a hierarchy of dimensions, categories, and components. All scores are normalized on a scale of 0 to 10 (10 being the highest risk).
Below is the clear breakdown of the index's architecture based on your descriptions:
The top-level score representing a country's overall risk of humanitarian crisis. It is used to assign countries into Risk Classes:
This dimension measures the predisposition of a population to be affected by a hazard based on economic, political, and social characteristics.
Sub-Index: Socio-Economic Vulnerability
An aggregate index covering three main components of systemic instability:
Sub-Index: Vulnerable Groups
Captures social groups with limited access to care and heightened susceptibility:
This dimension measures the ability of a country to manage and recover from disasters through its infrastructure and government effort.
Sub-Index: Institutional Capacity
Measures the "soft" infrastructure of a country's disaster management:
Sub-Index: Infrastructure
Measures the "hard" assets and systems available during a crisis: