Average time spent by households on fuel collection daily. The higher the number of daily hours that households spend in collecting fuel, the higher the improvements in the quality of life of communities due to electricity access.
Normalized Difference Vegetation Index (NDVI), Leaf Array Index (LAI), and Fraction of Absorbed photosynthetic Radiation (FAPAR) timeseries information from eStation services.
This layer represents the estimated travel time (in hours) by foot to the nearest healthcare facility. The underlying methodology is described in Weiss et al. (2020), which leverages major data collection efforts from OpenStreetMap, Google Maps, and academic sources to compile the most comprehensive global inventory of healthcare facility locations to date. The approach is based on the creation of friction surfaces that quantify the time required to traverse each ~1 km × 1 km pixel of the Earth's surface.
This layer represents the estimated travel time (in hours) by foot to the nearest primary school. The accessibility map is generated using a well-established geospatial methodology that integrates road and rail networks, land cover, and topographic features. The resulting gridded "friction surface" represents the time required to traverse each ~1 km × 1 km pixel of Africa.
The Fire Information for Resource Management System (FIRMS) of the National Aeronautics and Space Administration (NASA) uses satellite observations to detect active fires and thermal anomalies. They deliver this information to decision makers in near real-time (within 3 hours of satellite observation). This dataset includes active fires of the last 24h. Each point represents the centre of a 375 m resolution pixel where a fire was detected. It is updated twice daily. Compared to other coarser resolution (≥1km) satellite fire detection products, it provides improved response for smaller fires, improved mapping of large fire perimeters, and better detection at night, when fire activities usually occur. Consequently, the data are well suited for use in support of fire tracking and management (e.g., near real-time alert systems), as well as other science applications requiring improved fire mapping fidelity.
The Fire Information for Resource Management System (FIRMS) of the National Aeronautics and Space Administration (NASA) uses satellite observations to detect active fires and thermal anomalies. They deliver this information to decision makers in near real-time (within 3 hours of satellite observation). This dataset includes active fires of the last 48h. Each point represents the centre of a 375 m resolution pixel where a fire was detected. It is updated twice daily. Compared to other coarser resolution (≥1km) satellite fire detection products, it provides improved response for smaller fires, improved mapping of large fire perimeters, and better detection at night, when fire activities usually occur. Consequently, the data are well suited for use in support of fire tracking and management (e.g., near real-time alert systems), as well as other science applications requiring improved fire mapping fidelity.
The Fire Information for Resource Management System (FIRMS) of the National Aeronautics and Space Administration (NASA) uses satellite observations to detect active fires and thermal anomalies. They deliver this information to decision makers in near real-time (within 3 hours of satellite observation). This dataset includes active fires of the last 72h. Each point represents the centre of a 375 m resolution pixel where a fire was detected. It is updated twice daily. Compared to other coarser resolution (≥1km) satellite fire detection products, it provides improved response for smaller fires, improved mapping of large fire perimeters, and better detection at night, when fire activities usually occur. Consequently, the data are well suited for use in support of fire tracking and management (e.g., near real-time alert systems), as well as other science applications requiring improved fire mapping fidelity.
Number of deaths attributable to household air pollution resulting from solid fuels for cooking. Evidence from epidemiological studies have shown that exposure to smoke from incomplete combustion of solid fuels is linked with a range of conditions including acute and chronic respiratory diseases. Of these, evidence for three have been assessed on sufficiently strong basis for inclusion in the burden of disease estimates: acute lower respiratory infections in young children (under 5 years); chronic obstructive pulmonary disease in adults (above 25 years); lung cancer in adults (above 25 years).
Number of maternal deaths during a given time period per 100 000 live births during the same time period. The lower the number of healthcare facilities with access to electricity the greater the potential for decentralised renewable energies to reduce maternal mortality.
The world is shrinking. Cheap flights, large scale commercial shipping and expanding road networks all mean that we are better connected to everywhere else than ever before. Accessibility - whether it is to markets, schools, hospitals or water - is a precondition for the satisfaction of almost any economic need. The new map of Travel Time to Major Cities -developed by the European Commission and the World Bank- captures this connectivity and the concentration of economic activity. It also highlights that there is little wilderness left. The map shows the travel time (in hours/days) to major cities (i.e. cities of 50,000 or more people in year 2000) using land (road/off road) or water (navigable river, lake and ocean) based travel.
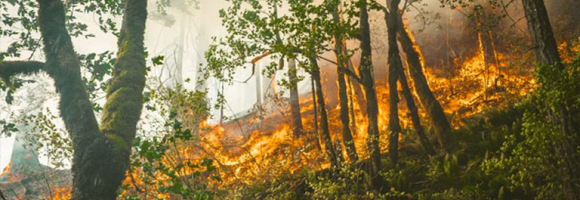
Vegetation fires have become a major concern in Africa because of their negative impacts on the environment and on human welfare. Uncontrolled (and un-prescribed) wildfires cause forest and vegetation degradation and related biodiversity loss, resulting in immediate and long-term impacts on the livelihoods of local communities and upstream impacts on national and regional economies. Fires in the tropical environment are a major contributor to tropical forest degradation and, if too frequent, can lead to savannisation of these areas. Vegetation fires are also a significant source of trace gases and aerosols in the atmosphere and contribute to the anticipated climate change, particularly with emissions of CO2. This layer shows the deviation of dekadal fire occurrences from the long-term average of the same 10-day period. A positive anomaly means more fire events than average for the last full 10-day period (red). A negative anomaly means less fire events than average for the last full 10-day period (green).
Many African countries, especially in the Sub-Saharan region highly depend on hydropower which is one of the energy sources that are most affected by droughts. At the same time hydropower has a huge impact on water consumption (mainly through evaporation from reservoir surfaces) in comparison with other fuel types despite having higher densities of plants and installed capacities. Hydropower accounts for 15% of Africa’s energy production. This map shows the energy production (GWh) of hydropower plants with an installed capacity above 5MW, aggregated for each hydropower-generating country in Africa for year 2016.