Main navigation
User account menu
Language
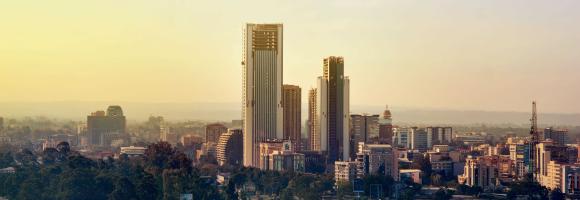
This data represents the distribution of human population between 1975 and 2030 in 5 year intervals over cells of 1x1 km size.
It derives from the GHS-POP - R2023A. Residential population estimates between 1975 and 2020 in 5-year intervals and projections to 2025 and 2030 derived from CIESIN GPWv4.11 were disaggregated from census or administrative units to grid cells, informed by the distribution, volume, and classification of built-up as mapped in the Global Human Settlement Layer (GHSL) global layer per corresponding epoch.
The dataset is part the Global Human Settlement Layer, that provide global, high-resolution, multi-temporal gridded data on built-up environment (built-up surface, built-up volume, residential vs. non-residential function), resident population, and settlement classification by the UN-recommended methodology “degree of urbanisation”. The complete information about the GHSL main products can be found in the GHSL Data Package 2023 report.
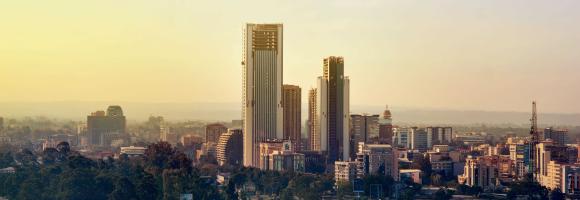
This data represents the distribution of human population between 1975 and 2030 in 5 year intervals over cells of 100x100 m size.
It derives from the GHS-POP - R2023A. Residential population estimates between 1975 and 2020 in 5-year intervals and projections to 2025 and 2030 derived from CIESIN GPWv4.11 were disaggregated from census or administrative units to grid cells, informed by the distribution, volume, and classification of built-up as mapped in the Global Human Settlement Layer (GHSL) global layer per corresponding epoch.
The dataset is part the Global Human Settlement Layer, that provide global, high-resolution, multi-temporal gridded data on built-up environment (built-up surface, built-up volume, residential vs. non-residential function), resident population, and settlement classification by the UN-recommended methodology “degree of urbanisation”. The complete information about the GHSL main products can be found in the GHSL Data Package 2023 report.

Percentage of undernourished people. The higher the incidence of undernourished people the more beneficial decentralised renewable energy solutions may be, in terms of improving both cooking facilities within households and agricultural productivity with positive impacts on nutrition. Thus electricity can be used to make agricultural practices more efficient and refrigerate food produce to store for longer.

Percentage of women who worked in the 12 months preceding the survey and are working currently. A lower score reflects weaker female emancipation within the labour market, and thus a higher potential impact of electricity access for improving women empowerment.

Percentage of women who are literate. This indicator highlights the importance of electricity for women, who spend the majority of their time taking care of the households. Electricity can ease girls and young women from houdeholds duties and allow them to attend schools. Thus, the lower the number of households with access to electricity the greater the potential for decentralised renewable energies to improve literacy levels among women.

Prevalence of underweight (weight-for-age <-2 standard deviation from the median of the World Health Organization (WHO) Child Growth Standards) among children under 5 years of age. Survey estimates are based on standardized methodology using the WHO Child Growth Standards. Global and regional estimates are based on methodology outlined in UNICEF-WHO-The World Bank: Joint child malnutrition estimates - Levels and trends (UNICEF/WHO/WB 2012).

''Intact Forest Landscapes (IFLs) are defined as those with an unfragmented area of at least 500 km2 and which are minimally influenced by human economic activity''.(Thies et al. 2011) IFLs are critical for stabilizing terrestrial carbon storage, harboring biodiversity, regulating hydrological regimes, and providing other ecosystem functions. Researchers, firstly, created a global IFL map using existing fine-scale maps and
a global coverage of high spatial resolution satellite imagery (Potapov et al. 2008). Moreover they assessed the distribution and dynamics of IFLs within the extent of present-day forest ecosystems tracking loss of intact forest landscapes from 2000 to 2020. In this layer we show the reduction of the IFL extent for African, Caribbean and Pacific (ACP)countries that decreased by 16,6% since the year 2000. Countries that experienced the largest reduction in intact forest landscape area over the past two decades are Solomon Islands with 66,3 %, Central African Republic with 57% and Equatorial Guinea with 50,4%. Democratic Republic of the Congo still has the highest proportion of intactness of ACP countries with 59,7Mha. IFL in Democratic Republic of the Congo has an extent of 64,3Mha as the 27,7% of its forest cover.
| Country | IFL Area in 2000 (sqkm) | IFL Area in 2020 (sqkm) | Percentage of IFL reduction |
| Angola | 2913.32 | 1752.85 | 39.83 |
| Belize | 4275.28 | 3598.44 | 15.83 |
| Cote d'Ivoire | 4558.78 | 3760.48 | 17.51 |
| Cameroon | 52752.96 | 31968.77 | 39.40 |
| Central African Republic | 8695.96 | 3727.14 | 57.14 |
| Congo | 138699.28 | 100215.44 | 27.75 |
| Cuba | 544.02 | 544.02 | 0.00 |
| Democratic Republic of the Congo | 643864.37 | 597275.75 | 7.24 |
| Dominican Republic | 795.21 | 564.89 | 28.96 |
| Equatorial Guinea | 4249.57 | 2104.83 | 50.47 |
| Ethiopia | 3671.63 | 3233.76 | 11.93 |
| Gabon | 108838.30 | 76291.78 | 29.90 |
| Guyana | 144296.97 | 117327.95 | 18.69 |
| Liberia | 4748.74 | 2880.65 | 39.34 |
| Madagascar | 17240.16 | 10799.08 | 37.36 |
| Nigeria | 2959.07 | 2416.10 | 18.35 |
| Papua New Guinea | 159523.52 | 127121.71 | 20.31 |
| Samoa | 650.86 | 643.16 | 1.18 |
| Solomon Islands | 7820.33 | 2630.05 | 66.37 |
| Suriname | 107282.59 | 92574.26 | 13.71 |
| Uganda | 984.66 | 962.06 | 2.30 |
| United Republic of Tanzania | 4081.92 | 3796.32 | 7.00 |
| Vanuatu | 706.13 | 688.33 | 2.52 |

Percentage of children 24-35 months who had received all age appropriate vaccinations. The lower the number of vaccinated children, the more beneficial decentralised renewable energy solutions may be in providing electricity to store vaccines in proper refrigerators.

Percentage of schools in Africa reporting to have no electricity. The lower the education facilities with access to electricity the greater the potential for decentralised renewable energies to improve electricity access in these facilities and thus educational outcomes.
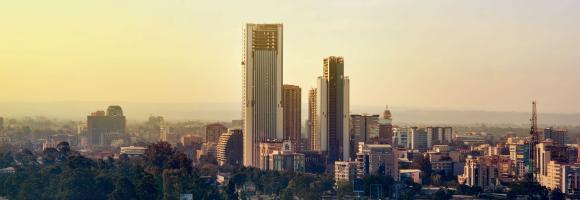
This data represents the distribution of human population between 1975 and 2030 in 5 year intervals over cells of 100x100 m size.
It derives from the GHS-POP - R2023A. Residential population estimates between 1975 and 2020 in 5-year intervals and projections to 2025 and 2030 derived from CIESIN GPWv4.11 were disaggregated from census or administrative units to grid cells, informed by the distribution, volume, and classification of built-up as mapped in the Global Human Settlement Layer (GHSL) global layer per corresponding epoch.
The dataset is part the Global Human Settlement Layer, that provide global, high-resolution, multi-temporal gridded data on built-up environment (built-up surface, built-up volume, residential vs. non-residential function), resident population, and settlement classification by the UN-recommended methodology “degree of urbanisation”. The complete information about the GHSL main products can be found in the GHSL Data Package 2023 report.
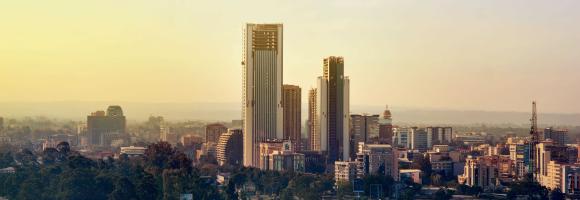
This data represents the distribution of human population between 1975 and 2030 in 5 year intervals over cells of 100x100 m size.
It derives from the GHS-POP - R2023A. Residential population estimates between 1975 and 2020 in 5-year intervals and projections to 2025 and 2030 derived from CIESIN GPWv4.11 were disaggregated from census or administrative units to grid cells, informed by the distribution, volume, and classification of built-up as mapped in the Global Human Settlement Layer (GHSL) global layer per corresponding epoch.
The dataset is part the Global Human Settlement Layer, that provide global, high-resolution, multi-temporal gridded data on built-up environment (built-up surface, built-up volume, residential vs. non-residential function), resident population, and settlement classification by the UN-recommended methodology “degree of urbanisation”. The complete information about the GHSL main products can be found in the GHSL Data Package 2023 report.
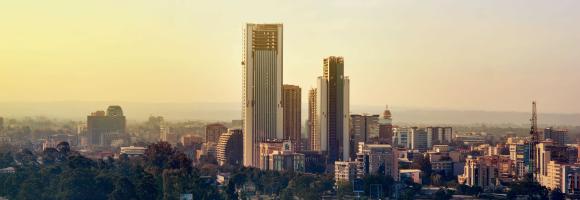
This data represents the distribution of human population between 1975 and 2030 in 5 year intervals over cells of 1x1 km size.
It derives from the GHS-POP - R2023A. Residential population estimates between 1975 and 2020 in 5-year intervals and projections to 2025 and 2030 derived from CIESIN GPWv4.11 were disaggregated from census or administrative units to grid cells, informed by the distribution, volume, and classification of built-up as mapped in the Global Human Settlement Layer (GHSL) global layer per corresponding epoch.
The dataset is part the Global Human Settlement Layer, that provide global, high-resolution, multi-temporal gridded data on built-up environment (built-up surface, built-up volume, residential vs. non-residential function), resident population, and settlement classification by the UN-recommended methodology “degree of urbanisation”. The complete information about the GHSL main products can be found in the GHSL Data Package 2023 report.
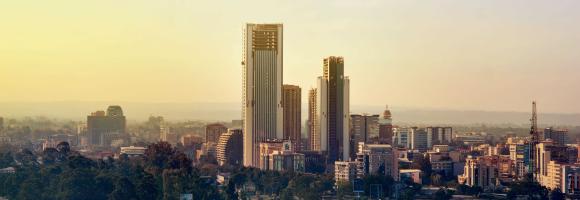
This data represents the distribution of human population between 1975 and 2030 in 5 year intervals over cells of 1x1 km size.
It derives from the GHS-POP - R2023A. Residential population estimates between 1975 and 2020 in 5-year intervals and projections to 2025 and 2030 derived from CIESIN GPWv4.11 were disaggregated from census or administrative units to grid cells, informed by the distribution, volume, and classification of built-up as mapped in the Global Human Settlement Layer (GHSL) global layer per corresponding epoch.
The dataset is part the Global Human Settlement Layer, that provide global, high-resolution, multi-temporal gridded data on built-up environment (built-up surface, built-up volume, residential vs. non-residential function), resident population, and settlement classification by the UN-recommended methodology “degree of urbanisation”. The complete information about the GHSL main products can be found in the GHSL Data Package 2023 report.

Percentage of healthcare facilities with electricity access in selected countries. Information on electricity access for healthcare facilities has been collected in the electricity access health facility database (EHFDB). The lower the healthcare facilities with access to electricity the greater the potential for decentralised renewable energies to improve electricity access in these facilities and thus healthcare outcomes.

Many African countries, especially in the Sub-Saharan region highly depend on hydropower which is one of the energy sources that are most affected by droughts. At the same time hydropower has a huge impact on water consumption (mainly through evaporation from reservoir surfaces) in comparison with other fuel types despite having higher densities of plants and installed capacities. Hydropower accounts for 15% of Africa’s energy production. This map shows the energy production (GWh) of hydropower plants with an installed capacity above 5MW, aggregated for each hydropower-generating country in Africa for year 2016.

Adult literacy rate is the percentage of people ages 15 and above who can both read and write with understanding a short simple statement about their everyday life. Literacy statistics for most countries cover the population ages 15 and older, but some include younger ages or are confined to age ranges that tend to inflate literacy rates. The youth literacy rate for ages 15-24 reflects recent progress in education. It measures the accumulated outcomes of primary education over the previous 10 years or so by indicating the proportion of the population who have passed through the primary education system and acquired basic literacy and numeracy skills.

This layer shows the percentage of children under 6 months who are exclusively breastfed, meaning they receive only breast milk without any additional food or drink. Exclusive breastfeeding is a key determinant of child survival, growth, and development.

The human imprint on the planet has a major impact on the functioning of the Earth system. Because the impact on the environment is closely intertwined with population dynamics, it is important to monitor and include these in the evaluation of land degradation. This layer displays the areas of concern for population change related issues derived from the convergence of global evidence of human-environment interactions that can lead to land degradation. It reflects the dynamics of increasing number of people in a certain area.
This layer is part of the World Altas of Desertification
According to UN estimates, the global population will increase by 2.4 billion between 2015 and 2050. Of this, an overwhelming 50 % will be concentrated in Africa (1.3 billion). There could be up to four times as many people in sub-Saharan Africa by the end of the century. The human imprint on the planet has a major impact on the functioning of the Earth system. Because the impact on the environment is closely intertwined with population dynamics, it is important to monitor and include these in the evaluation of land degradation. This layer displays the areas of concern for population density related issues derived from the convergence of global evidence of human-environment interactions that can lead to land degradation.
Constrained estimates of the total number of people per spatial unit, derived from high-resolution population distribution data produced by the WorldPop Global Demographic Data project. These estimates are based on a 30-arcsecond (~1 km) resolution modeling framework and incorporate official census counts, administrative boundaries, and a suite of geospatial covariates.
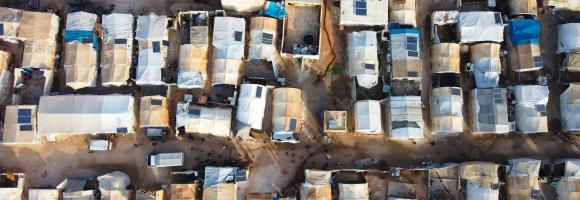

Percentage of children in a school attendance age (approximately 3-17 years old depending on the country) that have internet connection at home. Also in this case the indicator relates to the potential educational impact of electrification on children and young people.

The availability and quantity of observational species occurrence records have greatly increased due to technological advancements and the rise of online portals, such as the Global Biodiversity Information Facility (GBIF), coalescing occurrence records from multiple datasets. Funded by the world's governments, this international network and data infrastructure is aimed at providing anyone, anywhere, open access to data about all types of life on Earth. This map displays all the observations reported to the GBIF from 1600 to present. This knowledge derives from many sources, including everything from museum specimens collected in the 18th and 19th century to geotagged smartphone photos shared by amateur naturalists in recent days and weeks. Individual records are available at https://www.gbif.org
Development test dataset: random 0-100 values on the 0.35° Nature Africa grid clipped to the DRC. Not real data.
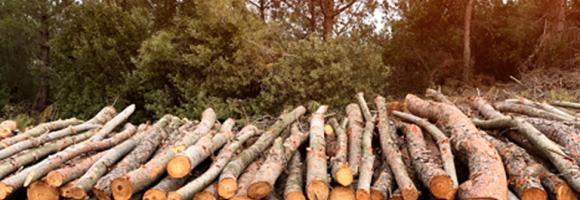
Carbon storage in biomass (biological material) is a key link in the global carbon cycle, and consequently for climate change mitigation. Forests in particular are an important carbon sink that help reduce the greenhouse effect. Together, the above-ground carbon (carbon fraction contained in the stems, barks, branches and twigs of living trees), the belowground biomass carbon (carbon fraction contained in roots of living trees) and the soil organic carbon (amount of carbon stored in the soil) provide a complete overview of the total carbon stored in forest areas (trees and soil). This map shows the total carbon stored expressed in units of dry mass (Mg) per ground area unit (km2).

The global capture fisheries has increased over the last 50 years as the consumption of seafood has doubled.This has increased pressure on fish stocks across the world. According to the State of World Fishery and Aquaculture 2020(FAO), the global capture fisheries production rose 14% from 1990 to 2018 and in 2018 it reached 96.4million tonnes. Here we show how much wild fish African countries caught in their EEZ in the last ten years (tonnes). In the attribute table you can find how much of the threatened marine fish species had be legally caught


This dataset provides the P50 projections for a geothermal system utilizing a Chiller unit.
Chiller refers to an absorption chiller or heat pump integrated into the geothermal system. It is used to provide cooling (by utilizing the geothermal heat) or to extract additional heat from the return fluid, thereby increasing the system's overall thermal harvest.
P50 is a statistical term used in risk analysis and forecasting. P50 represents the median scenario, meaning there is a 50% probability that the actual outcome will be higher than this value and a 50% probability it will be lower. It serves as the baseline "best estimate."
Metrics DefinitionsCoefficient of Performance (COP) [-]: A measure of efficiency, defined as the ratio of useful heating or cooling provided to the work (energy) required to operate the Chiller. Higher values indicate greater efficiency.
Doublet Net Production [MW]: The actual useful power output (Megawatts) generated by the "doublet" (one production well + one injection well), subtracting any energy used by pumps or auxiliary equipment.
Levelized Cost of Energy (LCOE) [US$ct/kWh]: The average revenue per unit of energy needed to recover the cost of building and operating the plant over its entire life cycle. It essentially represents the break-even price.
Net Present Value (NPV) [million US$]: The current financial value of all future cash flows the project will generate, minus the initial investment costs. A positive NPV generally indicates a profitable project.
Optimized Depth of the Aquifer [m]: The calculated ideal drilling depth (meters) to reach the geothermal reservoir that balances drilling costs with temperature/flow benefits.
Production Flow Rate [m³/h]: The volume of geothermal fluid extracted from the reservoir per hour (cubic meters per hour).
Temperature at Reservoir [°C]: The natural temperature (Celsius) of the geothermal fluid within the subsurface rock formation before it is brought to the surface.
Transmissivity [Dm]: A measure of how easily fluid flows through the porous aquifer. It is the product of hydraulic conductivity and aquifer thickness (often measured in Darcy-meters). High transmissivity means easier extraction.
Well Distance [m]: The physical distance (meters) between the production well (extraction) and the injection well (return). Proper spacing prevents "short-circuiting," where cool injected water lowers the temperature of the production well too quickly.
This dataset provides the P50 projections for a Direct Heat geothermal system.
Direct Heat refers to the use of geothermal energy for applications such as space heating, industrial processes, or agriculture. In the utilized model, it is assumed a minimum production temperature of at least 60°C and a reinjection temperature of 40°C.
P50 is a statistical term used in risk analysis and forecasting. P50 represents the median scenario, meaning there is a 50% probability that the actual outcome will be higher than this value and a 50% probability it will be lower. It serves as the baseline "best estimate."
Metrics DefinitionsCoefficient of Performance (COP) [-]: A measure of efficiency, defined as the ratio of useful heating or cooling provided to the work (energy) required to operate the Chiller. Higher values indicate greater efficiency.
Doublet Net Production [MW]: The actual useful power output (Megawatts) generated by the ""doublet"" (one production well + one injection well), subtracting any energy used by pumps or auxiliary equipment.
Levelized Cost of Energy (LCOE) [US$ct/kWh]: The average revenue per unit of energy needed to recover the cost of building and operating the plant over its entire life cycle. It essentially represents the break-even price.
Net Present Value (NPV) [million US$]: The current financial value of all future cash flows the project will generate, minus the initial investment costs. A positive NPV generally indicates a profitable project.
Optimized Depth of the Aquifer [m]: The calculated ideal drilling depth (meters) to reach the geothermal reservoir that balances drilling costs with temperature/flow benefits.
Production Flow Rate [m³/h]: The volume of geothermal fluid extracted from the reservoir per hour (cubic meters per hour).
Temperature at Reservoir [°C]: The natural temperature (Celsius) of the geothermal fluid within the subsurface rock formation before it is brought to the surface.
Transmissivity [Dm]: A measure of how easily fluid flows through the porous aquifer. It is the product of hydraulic conductivity and aquifer thickness (often measured in Darcy-meters). High transmissivity means easier extraction.
Well Distance [m]: The physical distance (meters) between the production well (extraction) and the injection well (return). Proper spacing prevents ""short-circuiting,"" where cool injected water lowers the temperature of the production well too quickly.
This dataset provides the P50 projections for a Direct Heat with Heat Pump geothermal system.
Direct Heat with Heat Pump refers to a scenario where a geothermal system is integrated with an industrial heat pump to upgrade low-grade heat. This allows for production from geothermal temperatures as low as 40°C, which are then heated by the pump to a delivery temperature of 80°C. The reinjection temperature is set to the production temperature minus 20°C, with a absolute minimum of 15°C.
P50 is a statistical term used in risk analysis and forecasting. P50 represents the median scenario, meaning there is a 50% probability that the actual outcome will be higher than this value and a 50% probability it will be lower. It serves as the baseline ""best estimate.""
Metrics DefinitionsCoefficient of Performance (COP) [-]: A measure of efficiency, defined as the ratio of useful heating or cooling provided to the work (energy) required to operate the Chiller. Higher values indicate greater efficiency.
Doublet Net Production [MW]: The actual useful power output (Megawatts) generated by the ""doublet"" (one production well + one injection well), subtracting any energy used by pumps or auxiliary equipment.
Levelized Cost of Energy (LCOE) [US$ct/kWh]: The average revenue per unit of energy needed to recover the cost of building and operating the plant over its entire life cycle. It essentially represents the break-even price.
Net Present Value (NPV) [million US$]: The current financial value of all future cash flows the project will generate, minus the initial investment costs. A positive NPV generally indicates a profitable project.
Optimized Depth of the Aquifer [m]: The calculated ideal drilling depth (meters) to reach the geothermal reservoir that balances drilling costs with temperature/flow benefits.
Production Flow Rate [m³/h]: The volume of geothermal fluid extracted from the reservoir per hour (cubic meters per hour).
Temperature at Reservoir [°C]: The natural temperature (Celsius) of the geothermal fluid within the subsurface rock formation before it is brought to the surface.
Transmissivity [Dm]: A measure of how easily fluid flows through the porous aquifer. It is the product of hydraulic conductivity and aquifer thickness (often measured in Darcy-meters). High transmissivity means easier extraction.
Well Distance [m]: The physical distance (meters) between the production well (extraction) and the injection well (return). Proper spacing prevents ""short-circuiting,"" where cool injected water lowers the temperature of the production well too quickly.
This dataset provides the P50 projections for an Organic Rankine Cycle (ORC) geothermal power plant.
Organic Rankine Cycle (ORC) refers to a binary power plant configuration where geothermal fluid (brine) is used to heat a secondary organic working fluid. This process allows for efficient electricity generation from medium-to-low temperature resources (typically 90°C to 150°C). The organic fluid vaporizes, drives a turbine, and is then condensed back into a liquid to repeat the cycle. The geothermal brine is reinjected into the reservoir after passing through the heat exchanger.
P50 is a statistical term used in risk analysis and forecasting. P50 represents the median scenario, meaning there is a 50% probability that the actual outcome will be higher than this value and a 50% probability it will be lower. It serves as the baseline ""best estimate.""
Metrics DefinitionsCoefficient of Performance (COP) [-]: A measure of efficiency, defined as the ratio of useful heating or cooling provided to the work (energy) required to operate the Chiller. Higher values indicate greater efficiency.
Doublet Net Production [MW]: The actual useful power output (Megawatts) generated by the ""doublet"" (one production well + one injection well), subtracting any energy used by pumps or auxiliary equipment.
Levelized Cost of Energy (LCOE) [US$ct/kWh]: The average revenue per unit of energy needed to recover the cost of building and operating the plant over its entire life cycle. It essentially represents the break-even price.
Net Present Value (NPV) [million US$]: The current financial value of all future cash flows the project will generate, minus the initial investment costs. A positive NPV generally indicates a profitable project.
Optimized Depth of the Aquifer [m]: The calculated ideal drilling depth (meters) to reach the geothermal reservoir that balances drilling costs with temperature/flow benefits.
Production Flow Rate [m³/h]: The volume of geothermal fluid extracted from the reservoir per hour (cubic meters per hour).
Temperature at Reservoir [°C]: The natural temperature (Celsius) of the geothermal fluid within the subsurface rock formation before it is brought to the surface.
Transmissivity [Dm]: A measure of how easily fluid flows through the porous aquifer. It is the product of hydraulic conductivity and aquifer thickness (often measured in Darcy-meters). High transmissivity means easier extraction.
Well Distance [m]: The physical distance (meters) between the production well (extraction) and the injection well (return). Proper spacing prevents ""short-circuiting,"" where cool injected water lowers the temperature of the production well too quickly.

This dataset provides the global geographic distribution of key livestock species—cattle, sheep, and goats—for the year 2010, sourced from the Gridded Livestock of the World (GLW 3) database. Expressed as the total number of animals per pixel at a spatial resolution of 5 minutes of arc, these layers are essential for diverse applications in agricultural socio-economics, food security, environmental impact assessments, and epidemiology.