This dataset compiles geophysical models detailing the thickness of the Earth's outer layers, ranging from surface sedimentary basins down to the base of the lithosphere. The collection serves a dual ...
Location of cross-sections (seismic, schematic or modelling). This data is digitilized from available literature data, source are reported in the attribute table.
This dataset is part of the L...
This dataset shows the location of hydrocarbon provinces with proven petroleum reserves. This data was compiled as part of the USGS's World Energy Project (WEP).This dataset is part of the LEAP-RE pro...
The IUCN IMMA layer identifies specific habitat areas crucial for one or more marine mammal species, which may be suitable for conservation through delineation and management. IMMAs represent regions ...
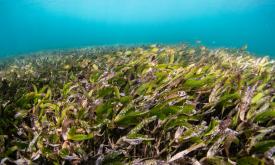
Seagrass is found on all continents except Antarctica, covering roughly 0.1% of the ocean floor. However, its global extent remains inadequately mapped, with estimates varying between 160,387 km² and ...
Seagrass is found on all continents except Antarctica, covering roughly 0.1% of the ocean floor. However, its global extent remains inadequately mapped, with estimates varying between 160,387 km² and ...
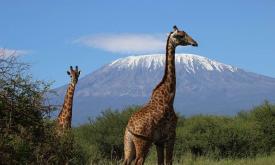
Tropical moist forests have a huge environmental value. They play an important role in biodiversity conservation, terrestrial carbon cycle, hydrological regimes, indigenous population subsistence and ...
The map is based on Copernicus Global Land Cover data which shows actual land cover (what physically covers land across the globe—forests, grasslands, croplands, lakes, wetlands, built-up area, etc) a...
This data represents the total built-up volume between 1975 and 2030 in 5 year intervals over cells of 1x1 km size.
It derives from the GHS-BUILT-V - R2023A spatial raster dataset, that depicts t...
This data represents the total built-up volume between 1975 and 2030 in 5 year intervals over cells of 1x1 km size.
It derives from the GHS-BUILT-V - R2023A spatial raster dataset, that depicts t...
Priority areas are identified using local coefficients estimated through Geographically Weighted Regression (GWR), which measures the spatially varying relationship between access to sanitation and fo...
Priority areas are identified using local coefficients estimated through Geographically Weighted Regression (GWR), which measures the spatially varying relationship between access to electricity and f...
Priority areas are identified using local coefficients estimated through Geographically Weighted Regression (GWR), which measures the spatially varying relationship between access to piped water and f...
This dataset represents a geographic clip to Africa of the
World Database on Protected Areas (WDPA),
which is the authoritative and most complete global dataset on terrestrial and ...
This spatial dataset contains the geographic boundaries and ecological evaluations of 45 Key Landscapes for Conservation and Development (KLCDs) across Sub-Saharan Africa. Building on the K...