Belgium
Biodiversity & Forest
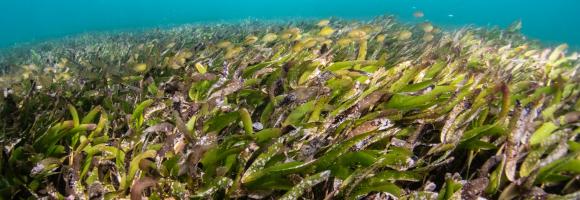
Seagrass is found on all continents except Antarctica, covering roughly 0.1% of the ocean floor. However, its global extent remains inadequately mapped, with estimates varying between 160,387 km² and 670,000 km², posing a significant challenge for conservation efforts. The UNEP-WCMC seagrass dataset indicates that Africa harbors approximately 12% of the world’s seagrass.
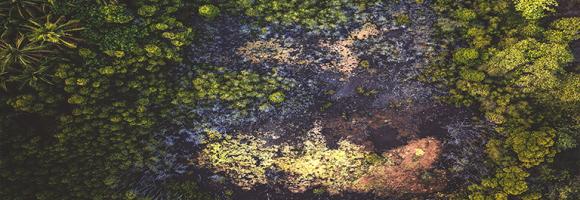
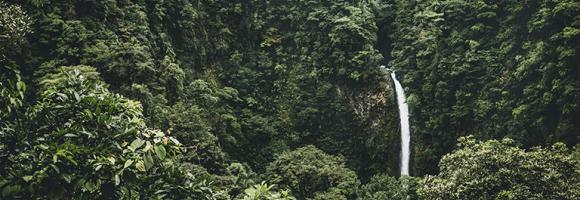
Tropical moist forests have a huge environmental value. They play an important role in biodiversity conservation, terrestrial carbon cycle, hydrological regimes, indigenous population subsistence and human health (1-5). They are increasingly recognized as an essential element of any strategy to mitigate climate change. Deforestation, and degradation compromise the functioning of tropical forests as an ecosystem, lead to biodiversity loss and reduced carbon storage capacity. Deforestation and fragmentation are increasing the risk of virus disease outbreaks. This map shows where deforestation occurred in the last three decades (between 1982 and 2020) and the year when the forest cover has been deforested for the first time (followed or not by a regrowth).
Forests worldwide are in a state of flux, with accelerating losses in some regions and gains in others. Given the recognized importance of forest ecosystem services, quantification of global forest extent and change is needed. This map displays the forest gain during the period 2000–2018. Forest gain is defined as the inverse of loss, or a change from non-forest to forest entirely within the study period. It is expressed as either 1 (gain) or 0 (no gain).
Forests worldwide are in a state of flux, with accelerating losses in some regions and gains in others. Given the recognized importance of forest ecosystem services, quantification of global forest extent and change is needed. This map displays the forest loss during the period 2000–2018, defined as a stand-replacement disturbance, or a change from forest to non-forest state. It is expressed as either 1 (loss - in red) or 0 (no loss).
Carbon storage in biomass (biological material) is a key link in the global carbon cycle, and consequently for climate change mitigation. Forests in particular are an important carbon sink that help reduce the greenhouse effect. Together, the above-ground carbon (carbon fraction contained in the stems, barks, branches and twigs of living trees), the belowground biomass carbon (carbon fraction contained in roots of living trees) and the soil organic carbon (amount of carbon stored in the soil) provide a complete overview of the total carbon stored in forest areas (trees and soil). This map shows the total carbon stored expressed in units of dry mass (Mg) per ground area unit (km2).
Forests worldwide are in a state of flux, with accelerating losses in some regions and gains in others. Given the recognized importance of forest ecosystem services, quantification of global forest extent and change is needed. This map displays the tree cover in the year 2000. Tree cover is defined as canopy closure for all vegetation taller than 5m in height and is expressed as a percentage per output grid cell, in the range 0–100.
Some areas in Africa represent spectacular, still viable examples of Africa’s wildlife and wild places. They are of such outstanding importance and value that they should be conserved at all costs and in principle forever. Those areas are referred to as Key Landscapes for Conservation or KLCs. A suitable network of KLCs has the potential to protect the well-known wildlife species within natural ecosystems and to stimulate rural economic growth.
Biodiversity hotspots are the Earth’s most biologically rich—yet heavily threatened—terrestrial regions. These are regions where success in conserving species can have an enormous impact in securing our global biodiversity. To qualify as a biodiversity hotspot, an area must meet two strict criteria: it must contain at least 1,500 species of vascular plants found nowhere else on Earth (known as "endemic" species), and it must have lost at least 70% of its primary native vegetation. 36 regions are identified as hotspots by Conservation International and partners, 9 of which lay (partially or fully) in Africa. This dataset shows their location.
Mangroves are trees or shrubs adapted to saline and brackish environments. They are found in the intertidal zone of tropical and sub-tropical coastlines. Mangrove forests are among the most productive ecosystems on earth. They serve many important functions, including water filtration, prevention of coastal erosion, carbon storage, food, timber and livelihood provision, and biodiversity protection (as they provide habitat, nurseries, and feeding grounds for a vast array of organisms). Despite their incredible value, mangrove forests are destroyed and degraded at a rate of about 1% per year as a result of land use change, exploitation, coastal development and climate change. This layer shows the change in mangrove extent -either stable, gain or loss- between 1996 and 2016.
Tropical moist forests have a huge environmental value. They play an important role in biodiversity conservation, terrestrial carbon cycle, hydrological regimes, indigenous population subsistence and human health (1-5). They are increasingly recognized as an essential element of any strategy to mitigate climate change. Accurate characterization of the tropical moist forests changes is needed to support conservation policies and to better quantify their contribution to global carbon fluxes. The transition map captures the dynamics of changes in tropical moist forests between the initial observation period (1990) and the end of the year 2020.
Africa is very rich in biodiversity and is the last place on Earth with a significant assemblage of large mammals. This natural richness, accumulated over millions of years, coupled with the wealth of indigenous and local knowledge on the continent, is central to the pursuit of sustainable development in the region. Yet the decline and loss of biodiversity is reducing nature’s contributions to people in Africa, affecting daily lives and hampering the sustainable social and economic targets set by African countries. This map shows the number of threatened mammal species by country, assessed by the International Union for the Conservation of Nature (IUCN) and documented in the IUCN Red List of Threatened Species. Established in 1964, the IUCN Red List is a critical indicator of the health of the world’s biodiversity that helps inform necessary conservation decisions.
Tropical moist forests have a huge environmental value. They play an important role in biodiversity conservation, terrestrial carbon cycle, hydrological regimes, indigenous population subsistence and human health (1-5). They are increasingly recognized as an essential element of any strategy to mitigate climate change. Accurate characterization of the tropical moist forests changes is needed to support conservation policies and to better quantify their contribution to global carbon fluxes. This map shows the coverage of undisturbed tropical moist forests remaining at the end of the year 2019.
Tropical moist forests have a huge environmental value. They play an important role in biodiversity conservation, terrestrial carbon cycle, hydrological regimes, indigenous population subsistence and human health (1-5). They are increasingly recognized as an essential element of any strategy to mitigate climate change. Deforestation, and degradation compromise the functioning of tropical forests as an ecosystem, lead to biodiversity loss and reduced carbon storage capacity. Deforestation and fragmentation are increasing the risk of virus disease outbreaks. This map shows where degradation occurred in the last three decades (between 1982 and 2020) and the year when the forest has been degraded for the first time (and remained degraded up to 2020).
Whether you’re monitoring crops, modelling green energy installations or soil sealing, combatting loss of natural resources or just helping countries meet their Sustainable Development Goals, chances are high that you’ll need an accurate and spatially detailed map on land cover and land use. Earth Observation satellites, like those from EU’s flagship programme Copernicus, are key to providing such maps, at a global scale, with free and open access. Land cover maps represent spatial information on different types (classes) of physical coverage of the Earth's surface, e.g. forests, grasslands, croplands, lakes, wetlands. Dynamic land cover maps include transitions of land cover classes over time and hence captures land cover changes. This dataset shows the land cover for the baseline year 2019 with a discrete classification in 23 classes aligned with UN-FAO's Land Cover Classification System.
The CO2 fixed by photosynthesis is one of the most important components of the carbon cycle. Forests play a key role in this process. They represent large and persistent carbon sinks. Tree carbon stocks are important to quantify terrestrial carbon storage and carbon sinks, and to estimate potential emissions from land cover changes (deforestation, reforestation, afforestation) and from biotic (pests, diseases) and abiotic (forest fires, windstorms) disturbances. Spatially explicit data and assessments of forest biomass and carbon are thus paramount to design and implement effective sustainable forest management options and forest related policies. The above-ground carbon index presented in this dataset is expressed in Mg (megagrams or tonnes) of carbon per km2 . It corresponds to the carbon fraction of the oven-dry weight of the woody parts (stem, bark, branches and twigs) of all living trees, excluding stump and roots, as estimated by the GlobBiomass project (globbiomass.org) with 2010 as the reference year.
Key Biodiversity Areas (KBAs) are the most important places in the world for species and their habitats. Faced with a global environmental crisis we need to focus our collective efforts on conserving the places that matter most. The KBA Programme supports the identification, mapping, monitoring and conservation of KBAs to help safeguard the most critical sites for nature on our planet – from rainforests to reefs, mountains to marshes, deserts to grasslands and to the deepest parts of the oceans. By providing the precise location of places that contribute significantly to the global persistence of biodiversity, KBAs can accelerate efforts to reverse the loss of nature, by ensuring conservation efforts are focussed in the places that matter most, and by enabling entities that may have negative impacts on nature to avoid or reduce those impacts in the places they would be most damaging. This layer shows the location of the KBAs, identified and mapped by the KBA partnership.
Displays areas where the geographic range of two or more endemic bird species overlaps. While many bird species are widespread, over 2,500 are endemic and restricted to an area smaller than 5 million hectares (restricted-range species). BirdLife International has mapped every restricted-range species using geo-referenced locality records. Through this process, they identified regions of the world—known as “Endemic Bird Areas” (EBAs)—where the distributions of two or more of these species overlap. Half of all restricted-range species are globally threatened or near-threatened, and the other half remain vulnerable to loss or degradation of habitat. The majority of EBAs are also important for the conservation of restricted-range species from other animal and plant groups. The unique landscapes where these bird species occur, amounting to just 4.5% of the earth's land surface, are high priorities for broad-scale ecosystem conservation. Geographically, EBAs are often islands or mountain ranges, and vary considerably in size, from a few hundred hectares to more than 10,000,000 hectares. EBAs also vary in the number of restricted-range species that they support (from two to 80). EBAs are found around the world, but most (77%) of them are located in the tropics and subtropics.
The Dead Wood Carbon and Litter Carbon pools have been estimated at global level as constant fractions of ESA Biomass CCI Above Ground Biomass (AGB), v.3 (2018) using a lookup table based on global ecological zone, elevation and precipitation regime, as proposed by Harris, N.L., Gibbs, D.A., Baccini, A. et al. Global maps of twenty-first century forest carbon fluxes. Nat. Clim. Chang. 11, 234–240 (2021). https://doi.org/10.1038/s41558-020-00976-6
Water
Surface water affects many aspects of our world: the exchange of heat, gas and water vapour between the planet's surface and atmosphere. Water is the engine behind the distribution, movement and migration of Earth's plant and animal life and is just as essential for humans. It affects our capacity to grow crops and manage animal grazing lands, to run our industrial processes, to manufacture goods, it influences the movement of disease-vectors, toxins and pollutants, it generates energy directly (hydroelectric) and indirectly (thermoelectric), it is an essential part of our transport network, and forms part of our recreational, cultural and sporting world. The Water Occurrence dataset shows where surface water occurred between 1984 and 2018. Open water is any stretch of water open to the sky, and includes both freshwater and saltwater. The map displays water surfaces greater than 30m2 that are visible from space, including natural (rivers, lakes, coastal margins and wetlands) and artificial water bodies (reservoirs formed by dams, flooded areas such as opencast mines and quarries, flood irrigation areas such as paddy fields, and water bodies created by hydro-engineering projects such as waterway and harbour construction). This product captures both the intra and inter-annual variability and changes. The permanent water surfaces (100% occurrence over 36 years) are represented in blue, and areas where water sometimes occurs are shown in shades of pink to purple (0% < occurrence < 100%). The paler shades are areas where the water occurs less frequently. The map can support better informed water-management decision-making.
Mangroves are trees or shrubs adapted to saline and brackish environments. They are found in the intertidal zone of tropical and sub-tropical coastlines. Mangrove forests are among the most productive ecosystems on earth. They serve many important functions, including water filtration, prevention of coastal erosion, carbon storage, food, timber and livelihood provision, and biodiversity protection (as they provide habitat, nurseries, and feeding grounds for a vast array of organisms). Despite their incredible value, mangrove forests are destroyed and degraded at a rate of about 1% per year as a result of land use change, exploitation, coastal development and climate change. This layer shows the change in mangrove extent -either stable, gain or loss- between 1996 and 2016.
The hydropower installed capacity indicates the amount of energy a hydropower plant can produce in its turbines. In 2016, hydropower accounted for 54% of the installed capacity in Eastern Africa, 58% in Central Africa and 30% in Western Africa with fourteen countries having a hydropower share above 50% and eight countries above 70%. These highly hydropower-dependent countries are particularly prone to electricity cuts due to the lack of water caused by severe droughts. This map shows the location and installed capacities of hydropower plants above 5MW installed capacity in Africa for year 2016, representing 95% of the total hydropower installed capacity in Africa.
Ocean temperature is related to ocean heat content (the energy absorbed by the ocean), an important topic in the study of global warming. Monitoring of sea surface temperature (SST) from earth-orbiting infrared radiometers has had a wide impact on oceanographic science. It provides fundamental information on the global climate system and for the study of marine ecosystems. For example, it helps estimating heat stress conducive to coral bleaching, the process by which they expel the symbiotic algae living in their tissues and become white (bleached) and vulnerable. The NOAA Coral Reef Watch Daily Global 5km Satellite Sea Surface Temperature product (a.k.a. CoralTemp) measures the night-time ocean temperature at the sea surface, calibrated to 0.2 meters depth.
Agroecology
The map is based on Copernicus Global Land Cover data which shows actual land cover (what physically covers land across the globe—forests, grasslands, croplands, lakes, wetlands, built-up area, etc) at 100m x 100m resolution. The land cover data for Africa was overlaid on (high resolution) satellite imagery of Africa, which is then used to determine the land use (by visual interpretation) associated with the various land cover patterns on the Copernicus Global Land Cover map.
Copernicus land cover data offers several advantages: it is of high quality, has a high resolution (100m x 100m), and offers time series satellite imagery. More importantly, the Copernicus Global Land Service is a continuous process and its datasets are updated annually. This means that the Soils4Africa map of agricultural land can be updated every time the land cover data for the new year becomes available (the map is currently based on 2019 data).
The Copernicus dataset already includes the category ‘cropland,’ which by definition is part of agricultural land. The Soils4Africa map broadens the scope of that dataset by infering information on agricultural use and including other kinds of agricultural land use such as grazing pastures and plantations.
When land is mapped as other than ‘cropland'-- like ‘shrubland’ for example-- it is more difficult to interpret and determine whether it is under agricultural use. The Copernicus dataset includes information about ‘fractional cover’-- or the percentage of a particular pixel under a particular kind of land cover (for example, 30% of a 100m x 100m pixel could be forest and 20% could be shrubland). The Soils4Africa map takes into account how fractional cover varies over an area to establish rules for interpreting its land cover data to determine whether it is under agricultural use and for what purpose. These rules were validated by comparing it with ground level information on land use (or land use pattern) for specific areas drawn from the interpretation of satellite imagery from Google Earth.
For example, ground-level observation shows that forest cover upwards of 30% in a given area when matched by shrubland cover of over 30%, is characterized by woody vegetation with a smooth canopy. Therefore, such area is more likely to be under plantations rather than natural forest. Thus, such an area should be counted as agricultural land, even if less than 15% of it is under crops.
In most people's mind, soil would not figure highly in a list of the natural resources of Africa. However, healthy and fertile soils are the cornerstones of food security, key environmental services, social cohesion and the economies of most African countries. Unfortunately, soil in Africa tends to reach public awareness only when it fails – often with catastrophic consequences as seen by the famine episodes of the Sahel in the 1980s and more recently in Niger and the Horn of Africa. In the context of major global environmental challenges such as food security, climate change, fresh water scarcity and biodiversity loss, the protection and the sustainable management of soil resources in Africa are of paramount importance. This layer presents the diversity of soil types across Africa. This map was produced by the Joint Research Centre of the European Commission for the Soil Atlas of Africa.
Humans need increasingly more biomass for food, fodder, fiber and energy. In Africa, circa 22% of the vegetated land surface showed a decline or unstable land productivity between 1999 and 2013. Persistent reduction of land productivity points to long-term alteration of the health and productive capacity of the land, which are characteristic of land degradation. It has impact on ecosystem services and benefits, thus on the sustainable livelihoods of human communities. This map shows the dynamics of (vegetated) land productivity over a time period, in other terms the trajectories of above-ground biomass. It reflects changes in ecosystem functioning e.g. vegetation growth cycles due to natural variation and/or human intervention, and can be associated with processes of land degradation or recovery. The 5 classes depict two levels of persistent productivity decline, one level of instability or stress in capacity, one level of stable productivity and one level of increased productivity.
By detecting areas where agricultural production deficits might occur, it is possible to prevent food security crises and anticipate response planning. To do this, we need accurate and reliable information on agricultural land cover. This layer shows the extent of cropland in Africa. Each pixel represents the fraction of the area covered by cropland (i.e. the percentage of the pixel with crops).
Food crisis response planning can save lives if put in place in a timely manner. To do this, decision makers must be warned of climate extreme events impacting agricultural production. The Anomaly hotSpot of Agricultural Production tool (ASAP) is an online decision support system for early warning about hotspots of agricultural production anomaly (crop and rangeland), developed by the JRC for food security crises prevention and response planning anticipation. This map shows the frequency of ASAP anomaly warnings for rangeland growth for 2004-2018. It highlights the high sensitivity of the main agricultural areas in Northern Africa, the Horn of Africa and the Southern African Development Community to drought conditions.
Food crisis response planning can save lives if put in place in a timely manner. To do this, decision makers must be warned of climate extreme events impacting agricultural production. The Anomaly hotSpot of Agricultural Production tool (ASAP) is an online decision support system for early warning about hotspots of agricultural production anomaly (crop and rangeland), developed by the JRC for food security crises prevention and response planning anticipation. This map shows the frequency of ASAP anomaly warnings for crop growth for 2004-2018. It highlights the high sensitivity of the main agricultural areas in Northern Africa, the Horn of Africa and the Southern African Development Community to drought conditions.
By detecting areas where agricultural production deficits might occur, it is possible to prevent food security crises and anticipate response planning. To do this, we need accurate and reliable information on agricultural land cover. This layer shows the extent of rangeland in Africa. Each pixel represents the fraction of the area covered by rangeland (i.e. the percentage of the pixel with rangeland).
Increasing water scarcity and water quality issues are serious constraints, especially for Northern Africa. A comprehensive assessment of spatial and temporal precipitation frequency is the initial step for defining public policies relating to water resources management and environmental monitoring. In the agricultural sector, a detailed knowledge of precipitation patterns is necessary to identify the most appropriate crop varieties for the region and to effectively manage climate related uncertainties. Precipitation frequency is also a central source of information for hazard mitigation and management. This layer shows the average annual precipitation (mm/year) for the period 1981-2017 across the continent.
Oil seed crops, especially oil palm, are among the most rapidly expanding agricultural land uses, and their expansion is known to cause significant environmental damage. Accordingly, these crops often feature in public and policy debates, which are hampered or biased by a lack of accurate information on environmental impacts. This dataset presents a global crop map. It covers areas where oil palm plantations were detected at global scale, and includes industrial and smallholder mature oil palm plantations.
Côte d'Ivoire and Ghana are the main largest producers of cocoa in the world. However, the cultivation of this crop has led to the loss of vast tracts of forest areas in both countries. Efficient and accurate methods for remotely identifying cocoa farms are essential for the implementation of sustainable cocoa practices and the periodic and effective monitoring of forests. This map, generated using Random Forest image classification, shows the 2019 distribution of cocoa farms in both countries. The estimated area for cocoa is 4.8Mha for Cote d'Ivoire and 2.3Mha for Ghana.
Humans need increasingly more biomass for food, fodder, fibre and energy. Meeting these demands changes global ecosystems. Tracking changes in total biomass production or land productivity is an essential part of monitoring land transformations that are typically associated with land degradation. Land productivity dynamics (LPD) are used as an indicator of change or stability of the land’s capacity to sustain primary production. This layer displays the areas of concern for land productivity related issues, derived from the convergence of global evidence of human-environment interactions that can have consequences on land degradation.
Soil organic carbon (SOC) is the carbon that remains in the soil after partial decomposition of any material produced by living organisms. It constitutes a key element of the global carbon cycle through atmosphere, vegetation, soil, rivers and the ocean. It is a crucial contributor to food production, mitigation and adaption to climate change. Soils represent the largest terrestrial organic carbon reservoir. Depending on local geology, climatic conditions and land use and management (amongst other environmental factors), soils hold different amounts of SOC. This map shows the amount of carbon stored in the soil (from 0 to 30 cm depth), expressed in Mg (megagrams or tonnes) per km2.
Roots are a long term and stable carbon sink, accounting for about 0.4 of the above ground biomass across biogeographical regions. Well established and developed root systems provide various ecosystem services related to improved soil quality (higher cation exchange capacity and nutrient turnaround) and characteristics (improved soil porosity and aeration). Spatially explicit data and assessments of forest biomass and carbon are paramount to design and implement effective sustainable forest management options and forest related policies. The belowground biomass carbon index (BBCI) presented in this dataset is expressed in Mg (Megagrams or Tonnes) of carbon per km2. It represents an estimation of the carbon stored in the roots of all living trees. Together with the above-ground carbon index (AGCI) and the soil organic content index (SOCI), it provides a complete overview of the total carbon stored in forest areas (trees and soil).
The African Development Corridors Database (ADCD) is a comprehensive, georeferenced database detailing 79 ongoing and planned investment corridors across Africa, synthesizing data on 184 specific infrastructure projects (railways, ports, pipelines, airports, techno-cities, and industrial parks). Its purpose is to allow for critical assessment of the spatial and temporal impacts of massive infrastructure investments to maximize development opportunities and support the UN Sustainable Development Goals and AU Agenda 2063. The database includes 22 interlinked tabular and spatial attributes with provided sources, which is expected to improve coordination, efficiency, strategic planning, transparency, and impact assessments for governments, investment banks, practitioners, and conservationists, among other stakeholders.
Ocean
Seagrass is found on all continents except Antarctica, covering roughly 0.1% of the ocean floor. However, its global extent remains inadequately mapped, with estimates varying between 160,387 km² and 670,000 km², posing a significant challenge for conservation efforts. The UNEP-WCMC seagrass dataset indicates that Africa harbors approximately 12% of the world’s seagrass.
Surface water affects many aspects of our world: the exchange of heat, gas and water vapour between the planet's surface and atmosphere. Water is the engine behind the distribution, movement and migration of Earth's plant and animal life and is just as essential for humans. It affects our capacity to grow crops and manage animal grazing lands, to run our industrial processes, to manufacture goods, it influences the movement of disease-vectors, toxins and pollutants, it generates energy directly (hydroelectric) and indirectly (thermoelectric), it is an essential part of our transport network, and forms part of our recreational, cultural and sporting world. The Water Occurrence dataset shows where surface water occurred between 1984 and 2018. Open water is any stretch of water open to the sky, and includes both freshwater and saltwater. The map displays water surfaces greater than 30m2 that are visible from space, including natural (rivers, lakes, coastal margins and wetlands) and artificial water bodies (reservoirs formed by dams, flooded areas such as opencast mines and quarries, flood irrigation areas such as paddy fields, and water bodies created by hydro-engineering projects such as waterway and harbour construction). This product captures both the intra and inter-annual variability and changes. The permanent water surfaces (100% occurrence over 36 years) are represented in blue, and areas where water sometimes occurs are shown in shades of pink to purple (0% < occurrence < 100%). The paler shades are areas where the water occurs less frequently. The map can support better informed water-management decision-making.
Water is essential for life on Earth and a critical natural resource that underpins all social and economic activity. Ensuring water and sanitation for all is one of the Sustainable Development Goals (SDG 6) of the 2030 Agenda. Target 6.6 specifically aims to protect and restore water-related ecosystems, including wetlands. This map shows the total area covered by inland vegetated wetlands. It includes swamps, marshes, peatlands, bogs and fens, the vegetated parts of floodplains as well as rice paddies and flood recession agriculture.
Climate Change Resilience
Seagrass is found on all continents except Antarctica, covering roughly 0.1% of the ocean floor. However, its global extent remains inadequately mapped, with estimates varying between 160,387 km² and 670,000 km², posing a significant challenge for conservation efforts. The UNEP-WCMC seagrass dataset indicates that Africa harbors approximately 12% of the world’s seagrass.
Tropical moist forests have a huge environmental value. They play an important role in biodiversity conservation, terrestrial carbon cycle, hydrological regimes, indigenous population subsistence and human health (1-5). They are increasingly recognized as an essential element of any strategy to mitigate climate change. Deforestation, and degradation compromise the functioning of tropical forests as an ecosystem, lead to biodiversity loss and reduced carbon storage capacity. Deforestation and fragmentation are increasing the risk of virus disease outbreaks. This map shows where deforestation occurred in the last three decades (between 1982 and 2020) and the year when the forest cover has been deforested for the first time (followed or not by a regrowth).
This data represents the total built-up volume between 1975 and 2030 in 5 year intervals over cells of 1x1 km size.
It derives from the GHS-BUILT-V - R2023A spatial raster dataset, that depicts the distribution of built-up volumes, expressed as number of cubic metres. The data report about the total built-up volume and the built-up volume allocated to dominant non-residential (NRES) uses.
The dataset is part the Global Human Settlement Layer , Global, high-resolution, multi-temporal gridded data on built-up environment (built-up surface, built-up volume, residential vs. non-residential function), resident population, and settlement classification by the UN-recommended methodology “degree of urbanisation”. The complete information about the GHSL main products can be found in the GHSL Data Package 2023 report
Africa is projected to have the fastest urban growth rate in the world — by 2050, Africa’s cities will be home to an additional 950 million people. Urban planning and management are essential development challenges. Understanding urbanisation, its drivers, dynamics and impacts, is key to designing targeted, inclusive and foward-looking policies at the local, national and continental levels. Africapolis data and evidence supports cities and governments to make urban areas more inclusive, productive and sustainable. This map of urban population covers 7 500 agglomerations in 50 countries for the base year 2015.
Forests worldwide are in a state of flux, with accelerating losses in some regions and gains in others. Given the recognized importance of forest ecosystem services, quantification of global forest extent and change is needed. This map displays the forest loss during the period 2000–2018, defined as a stand-replacement disturbance, or a change from forest to non-forest state. It is expressed as either 1 (loss - in red) or 0 (no loss).
Increasing water scarcity and water quality issues are serious constraints, especially for Northern Africa. A comprehensive assessment of spatial and temporal precipitation frequency is the initial step for defining public policies relating to water resources management and environmental monitoring. In the agricultural sector, a detailed knowledge of precipitation patterns is necessary to identify the most appropriate crop varieties for the region and to effectively manage climate related uncertainties. Precipitation frequency is also a central source of information for hazard mitigation and management. This layer shows the average annual precipitation (mm/year) for the period 1981-2017 across the continent.
Tropical moist forests have a huge environmental value. They play an important role in biodiversity conservation, terrestrial carbon cycle, hydrological regimes, indigenous population subsistence and human health (1-5). They are increasingly recognized as an essential element of any strategy to mitigate climate change. Accurate characterization of the tropical moist forests changes is needed to support conservation policies and to better quantify their contribution to global carbon fluxes. The transition map captures the dynamics of changes in tropical moist forests between the initial observation period (1990) and the end of the year 2020.
Tropical moist forests have a huge environmental value. They play an important role in biodiversity conservation, terrestrial carbon cycle, hydrological regimes, indigenous population subsistence and human health (1-5). They are increasingly recognized as an essential element of any strategy to mitigate climate change. Deforestation, and degradation compromise the functioning of tropical forests as an ecosystem, lead to biodiversity loss and reduced carbon storage capacity. Deforestation and fragmentation are increasing the risk of virus disease outbreaks. This map shows where degradation occurred in the last three decades (between 1982 and 2020) and the year when the forest has been degraded for the first time (and remained degraded up to 2020).
Tropical moist forests have a huge environmental value. They play an important role in biodiversity conservation, terrestrial carbon cycle, hydrological regimes, indigenous population subsistence and human health (1-5). They are increasingly recognized as an essential element of any strategy to mitigate climate change. Accurate characterization of the tropical moist forests changes is needed to support conservation policies and to better quantify their contribution to global carbon fluxes. This map shows the coverage of undisturbed tropical moist forests remaining at the end of the year 2019.
Ocean temperature is related to ocean heat content (the energy absorbed by the ocean), an important topic in the study of global warming. Monitoring of sea surface temperature (SST) from earth-orbiting infrared radiometers has had a wide impact on oceanographic science. It provides fundamental information on the global climate system and for the study of marine ecosystems. For example, it helps estimating heat stress conducive to coral bleaching, the process by which they expel the symbiotic algae living in their tissues and become white (bleached) and vulnerable. The NOAA Coral Reef Watch Daily Global 5km Satellite Sea Surface Temperature product (a.k.a. CoralTemp) measures the night-time ocean temperature at the sea surface, calibrated to 0.2 meters depth.
The Fire Information for Resource Management System (FIRMS) of the National Aeronautics and Space Administration (NASA) uses satellite observations to detect active fires and thermal anomalies. They deliver this information to decision makers in near real-time (within 3 hours of satellite observation). This dataset includes active fires of the last 24h. Each point represents the centre of a 375 m resolution pixel where a fire was detected. It is updated twice daily. Compared to other coarser resolution (≥1km) satellite fire detection products, it provides improved response for smaller fires, improved mapping of large fire perimeters, and better detection at night, when fire activities usually occur. Consequently, the data are well suited for use in support of fire tracking and management (e.g., near real-time alert systems), as well as other science applications requiring improved fire mapping fidelity.
Humans need increasingly more biomass for food, fodder, fibre and energy. Meeting these demands changes global ecosystems. Tracking changes in total biomass production or land productivity is an essential part of monitoring land transformations that are typically associated with land degradation. Land productivity dynamics (LPD) are used as an indicator of change or stability of the land’s capacity to sustain primary production. This layer displays the areas of concern for land productivity related issues, derived from the convergence of global evidence of human-environment interactions that can have consequences on land degradation.
Fire is a natural part of all ecosystems. Wildfires have been burning vegetation and shaping landscapes far longer than people have been on Earth. However, changes in fire frequency and timing can result in degradation if the vegetation is not adapted to the new fire regimes. This can cause long-term damage to land biomass components affecting soil structure, nutrients and water cycling. This layer displays the areas of concern for fires related issues derived from the convergence of global evidence of human-environment interactions that can have consequences on land degradation.