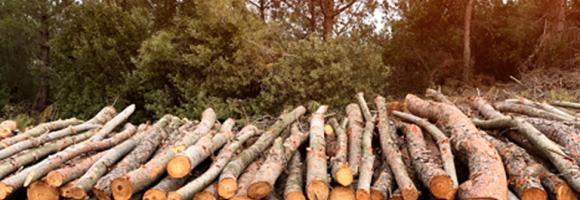
Carbon storage in biomass (biological material) is a key link in the global carbon cycle, and consequently for climate change mitigation. Forests in particular are an important carbon sink that help reduce the greenhouse effect. Together, the above-ground carbon (carbon fraction contained in the stems, barks, branches and twigs of living trees), the belowground biomass carbon (carbon fraction contained in roots of living trees) and the soil organic carbon (amount of carbon stored in the soil) provide a complete overview of the total carbon stored in forest areas (trees and soil). This map shows the total carbon stored expressed in units of dry mass (Mg) per ground area unit (km2).
The CO2 fixed by photosynthesis is one of the most important components of the carbon cycle. Forests play a key role in this process. They represent large and persistent carbon sinks. Tree carbon stocks are important to quantify terrestrial carbon storage and carbon sinks, and to estimate potential emissions from land cover changes (deforestation, reforestation, afforestation) and from biotic (pests, diseases) and abiotic (forest fires, windstorms) disturbances. Spatially explicit data and assessments of forest biomass and carbon are thus paramount to design and implement effective sustainable forest management options and forest related policies. The above-ground carbon index presented in this dataset is expressed in Mg (megagrams or tonnes) of carbon per km2 . It corresponds to the carbon fraction of the oven-dry weight of the woody parts (stem, bark, branches and twigs) of all living trees, excluding stump and roots, as estimated by the GlobBiomass project (globbiomass.org) with 2010 as the reference year.
Roots are a long term and stable carbon sink, accounting for about 0.4 of the above ground biomass across biogeographical regions. Well established and developed root systems provide various ecosystem services related to improved soil quality (higher cation exchange capacity and nutrient turnaround) and characteristics (improved soil porosity and aeration). Spatially explicit data and assessments of forest biomass and carbon are paramount to design and implement effective sustainable forest management options and forest related policies. The belowground biomass carbon index (BBCI) presented in this dataset is expressed in Mg (Megagrams or Tonnes) of carbon per km2. It represents an estimation of the carbon stored in the roots of all living trees. Together with the above-ground carbon index (AGCI) and the soil organic content index (SOCI), it provides a complete overview of the total carbon stored in forest areas (trees and soil).
Mangroves provide both climate change mitigation and adaptation services. They provide benefits for coastal communities and they are among the most effective carbon-capture ecosystems. If they are degraded or cleared, the carbon stored will be released into the atmosphere as CO2 and it will exacerbate climate changes. Target 8 of the First Draft of the Post-2020 Global Biodiversity Framework said: “Minimize the impact of climate change on biodiversity, contribute to mitigation and adaptation through ecosystem-based approaches, contributing at least 10 GtCO2e per year to global mitigation efforts, and ensure that all mitigation and adaptation efforts avoid negative impacts on biodiversity.” Mangrove habitats contribute to climate mitigation targets. This layer wants to show the percentage of total carbon stored in mangroves per ACP country in comparison with the global mangrove total organic carbon stored.
The data provided here are the result of a time-series analysis of carbon density change (in Mg/ha) between 2003-2014 spanning tropical America, Africa, and Asia (23.45 N lat.-23.45 S lat.). The original data is provided as two separate rasters representing (1) carbon density net gain and (2) carbon density net loss within each ~463 x 463 metre pixel, with only pixels exhibiting statistical significance at the 95% level being reported. The data here was re-projected from the its original MODIS sinusoidal projection to WGS84.
Percentage of children 24-35 months who had received all age appropriate vaccinations. The lower the number of vaccinated children, the more beneficial decentralised renewable energy solutions may be in providing electricity to store vaccines in proper refrigerators.
The Dead Wood Carbon and Litter Carbon pools have been estimated at global level as constant fractions of ESA Biomass CCI Above Ground Biomass (AGB), v.3 (2018) using a lookup table based on global ecological zone, elevation and precipitation regime, as proposed by Harris, N.L., Gibbs, D.A., Baccini, A. et al. Global maps of twenty-first century forest carbon fluxes. Nat. Clim. Chang. 11, 234–240 (2021). https://doi.org/10.1038/s41558-020-00976-6
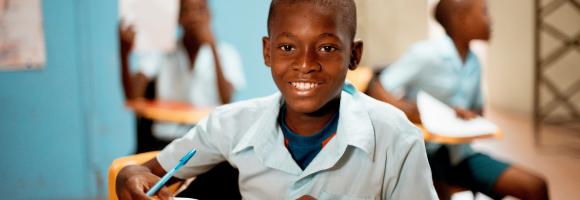
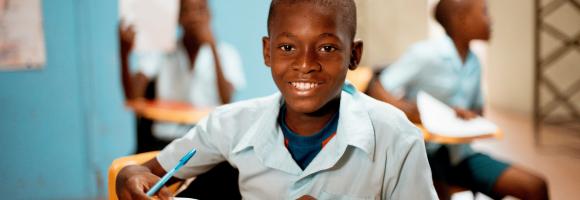
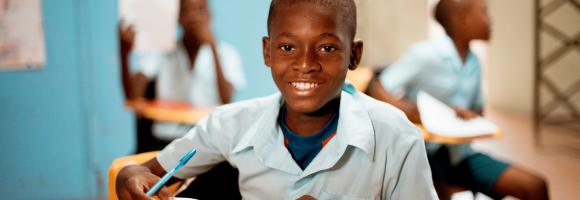
Percentage of schools in Africa reporting to have no electricity. The lower the education facilities with access to electricity the greater the potential for decentralised renewable energies to improve electricity access in these facilities and thus educational outcomes.
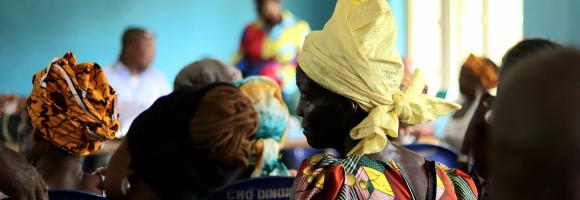
Percentage of women who worked in the 12 months preceding the survey and are working currently. A lower score reflects weaker female emancipation within the labour market, and thus a higher potential impact of electricity access for improving women empowerment.
Percentage of healthcare facilities with electricity access in selected countries. Information on electricity access for healthcare facilities has been collected in the electricity access health facility database (EHFDB). The lower the healthcare facilities with access to electricity the greater the potential for decentralised renewable energies to improve electricity access in these facilities and thus healthcare outcomes.
Many African countries, especially in the Sub-Saharan region highly depend on hydropower which is one of the energy sources that are most affected by droughts. At the same time hydropower has a huge impact on water consumption (mainly through evaporation from reservoir surfaces) in comparison with other fuel types despite having higher densities of plants and installed capacities. Hydropower accounts for 15% of Africa’s energy production. This map shows the energy production (GWh) of hydropower plants with an installed capacity above 5MW, aggregated for each hydropower-generating country in Africa for year 2016.
A new paper published in Nature Sustainability mapped the irrecoverable carbon in earth's ecosystems. It shows how manageable, vulnerable and irrecoverable carbon are distributed among ecosystems. Peatland, mangrove forests, old-growth forests are the most important- reserve of irrecoverable carbon. ““Irrecoverable carbon” refers to the vast stores of carbon in nature that are vulnerable to release from human activity and, if lost, could not be restored by 2050 — when the world must reach net-zero emissions to avoid the worst impacts of climate change..”. Here we are showing the percentage of irrecoverable carbon density by ACP country in million tonnes.Check in BIOPAMA RIS the mean of irrecoverable carbon density for the year 2018 in Mg/ha that falls within protected and conserved areas in ACP countries. Source: Noon, M.L., Goldstein, A., Ledezma, J.C. et al. Mapping the irrecoverable carbon in Earth’s ecosystems. Nat Sustain 5, 37–46 (2022). https://doi.org/10.1038/s41893-021-00803-6
Percentage of women who are literate. This indicator highlights the importance of electricity for women, who spend the majority of their time taking care of the households. Electricity can ease girls and young women from houdeholds duties and allow them to attend schools. Thus, the lower the number of households with access to electricity the greater the potential for decentralised renewable energies to improve literacy levels among women.
Adult literacy rate is the percentage of people ages 15 and above who can both read and write with understanding a short simple statement about their everyday life. Literacy statistics for most countries cover the population ages 15 and older, but some include younger ages or are confined to age ranges that tend to inflate literacy rates. The youth literacy rate for ages 15-24 reflects recent progress in education. It measures the accumulated outcomes of primary education over the previous 10 years or so by indicating the proportion of the population who have passed through the primary education system and acquired basic literacy and numeracy skills.
The Dead Wood Carbon and Litter Carbon pools have been estimated at global level as constant fractions of ESA Biomass CCI Above Ground Biomass (AGB), v.3 (2018) using a lookup table based on global ecological zone, elevation and precipitation regime, as proposed by Harris, N.L., Gibbs, D.A., Baccini, A. et al. Global maps of twenty-first century forest carbon fluxes. Nat. Clim. Chang. 11, 234–240 (2021). https://doi.org/10.1038/s41558-020-00976-6
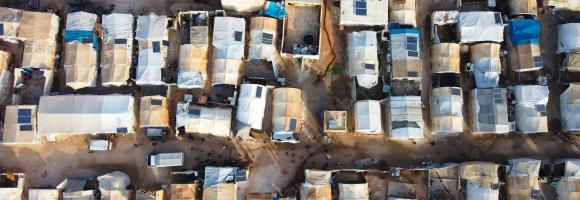
The dataset depicts the total energy demand per settlement (kWh/day) at year 5 under scenario with household consumption raised to 1000 Wh/day (at year 0). This dataset is part of the e Refugee Settlements Electricity Access (RSEA) database, designed and developed to gather the multidimensional factors that can determine a refugee settlement's energy dimension. These factors were chiefly environmental (such as variability of solar radiation and avoided GHG emissions), technical (electrification status, distance to grid), social (population, electricity demand, social infrastructure), and economic (e.g., PV mini-grid component prices) considerations that can influence a stakeholder decision on the deployment of a PV and battery storage mini-grid in a displacement setting.
Soil organic carbon (SOC) is the carbon that remains in the soil after partial decomposition of any material produced by living organisms. It constitutes a key element of the global carbon cycle through atmosphere, vegetation, soil, rivers and the ocean. It is a crucial contributor to food production, mitigation and adaption to climate change. Soils represent the largest terrestrial organic carbon reservoir. Depending on local geology, climatic conditions and land use and management (amongst other environmental factors), soils hold different amounts of SOC. This map shows the amount of carbon stored in the soil (from 0 to 30 cm depth), expressed in Mg (megagrams or tonnes) per km2.
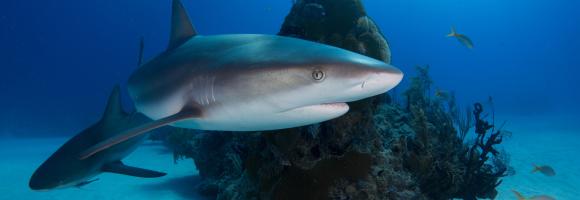
The global capture fisheries has increased over the last 50 years as the consumption of seafood has doubled.This has increased pressure on fish stocks across the world. According to the State of World Fishery and Aquaculture 2020(FAO), the global capture fisheries production rose 14% from 1990 to 2018 and in 2018 it reached 96.4million tonnes. Here we show how much wild fish African countries caught in their EEZ in the last ten years (tonnes). In the attribute table you can find how much of the threatened marine fish species had be legally caught
Percentage of undernourished people. The higher the incidence of undernourished people the more beneficial decentralised renewable energy solutions may be, in terms of improving both cooking facilities within households and agricultural productivity with positive impacts on nutrition. Thus electricity can be used to make agricultural practices more efficient and refrigerate food produce to store for longer.
Prevalence of underweight (weight-for-age <-2 standard deviation from the median of the World Health Organization (WHO) Child Growth Standards) among children under 5 years of age. Survey estimates are based on standardized methodology using the WHO Child Growth Standards. Global and regional estimates are based on methodology outlined in UNICEF-WHO-The World Bank: Joint child malnutrition estimates - Levels and trends (UNICEF/WHO/WB 2012).