The hydropower installed capacity indicates the amount of energy a hydropower plant can produce in its turbines. In 2016, hydropower accounted for 54% of the installed capacity in Eastern Africa, 58% in Central Africa and 30% in Western Africa with fourteen countries having a hydropower share above 50% and eight countries above 70%. These highly hydropower-dependent countries are particularly prone to electricity cuts due to the lack of water caused by severe droughts. This map shows the location and installed capacities of hydropower plants above 5MW installed capacity in Africa for year 2016, representing 95% of the total hydropower installed capacity in Africa.
Many African countries, especially in the Sub-Saharan region highly depend on hydropower which is one of the energy sources that are most affected by droughts. At the same time hydropower has a huge impact on water consumption (mainly through evaporation from reservoir surfaces) in comparison with other fuel types despite having higher densities of plants and installed capacities. Hydropower accounts for 15% of Africa’s energy production. This map shows the energy production (GWh) of hydropower plants with an installed capacity above 5MW, aggregated for each hydropower-generating country in Africa for year 2016.
"This map shows, for each grid cell, the environmental impact in terms of CO₂-equivalent emissions per kilowatt-hour [g CO2 eq/kWh] generated by by the following systems:
Cooling Absorption System;
Refrigeration Absorption System;
Binary ORC Power Plant;
Flash Power Plant;
Heat for Direct Use;
Heat for High Temperature Heat Pump;
The maps refer to:
base case scenario;
upside scenario, modelling a better fluid flow;
up up side, modelling both better fluid flow and higher underground temperatures.
This dataset shows the African power plants and their installed capacity in MegaWatt (MW). It includes thermal plants (coal, gas, oil, nuclear, biomass, waste, geothermal) and renewables (hydro, wind, solar). Each power plant is geolocated and entries contain information on plant capacity and generation.
Higher energy demands in Africa has led to a wide expansion of the number of hydropower sites, mainly between the 1960s and 1980s. The construction of dams causes impoundments of rivers and reservoirs in the regions of dam influence, with higher evaporation and water temperatures due to increased water surfaces. This map shows the he surface area (sqkm) of African reservoirs subject to hydropower production for the year 2016. It includes reservoirs of associated hydropower plants with installed capacities above 5MW. Apart from this, only reservoirs with a detected dam-caused impoundment of water surface are considered.
Percentage of children 24-35 months who had received all age appropriate vaccinations. The lower the number of vaccinated children, the more beneficial decentralised renewable energy solutions may be in providing electricity to store vaccines in proper refrigerators.
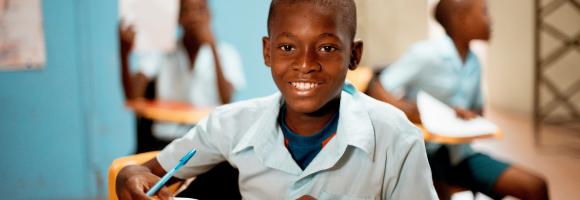
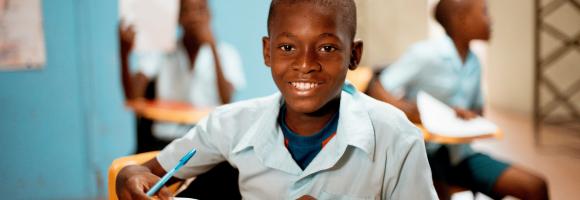
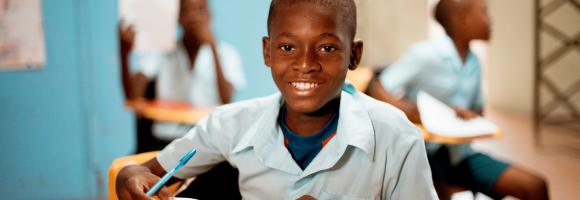
Percentage of schools in Africa reporting to have no electricity. The lower the education facilities with access to electricity the greater the potential for decentralised renewable energies to improve electricity access in these facilities and thus educational outcomes.
Percentage of women who worked in the 12 months preceding the survey and are working currently. A lower score reflects weaker female emancipation within the labour market, and thus a higher potential impact of electricity access for improving women empowerment.
Percentage of healthcare facilities with electricity access in selected countries. Information on electricity access for healthcare facilities has been collected in the electricity access health facility database (EHFDB). The lower the healthcare facilities with access to electricity the greater the potential for decentralised renewable energies to improve electricity access in these facilities and thus healthcare outcomes.
The INFORM Risk Index 2021 is a composite model structured into a hierarchy of dimensions, categories, and components. All scores are normalized on a scale of 0 to 10 (10 being the highest risk).
Below is the clear breakdown of the index's architecture based on your descriptions:
The Composite Index
The top-level score representing a country's overall risk of humanitarian crisis. It is used to assign countries into Risk Classes:
Low: ≤3.5
Medium: 3.5−5.0
High: 5.0−6.5
Very High: ≥6.5
Dimension: Vulnerability
This dimension measures the predisposition of a population to be affected by a hazard based on economic, political, and social characteristics.
Sub-Index: Socio-Economic Vulnerability
An aggregate index covering three main components of systemic instability:
Development Deprivation: Measures poverty using the Human Development Index (HDI) and Multidimensional Poverty Index (MPI).
Inequality: Captures the dispersion of human development, including the Gender Inequality Index and the Gini Coefficient.
Aid Dependency: Measures economic instability through reliance on public aid, development assistance, and remittances.
Sub-Index: Vulnerable Groups
Captures social groups with limited access to care and heightened susceptibility:
Uprooted People: Tracks refugees, IDPs, and returnees.
Children Under 5: Specifically monitors child malnutrition and mortality rates.
Recent Shocks: Factors in populations already affected by natural disasters in the last 3 years.
Food Security: Captures trends in chronic hunger and nutritional balance.
Health Conditions: Monitors the prevalence of pandemics (HIV, TB, Malaria) and neglected tropical diseases.
Dimension: Lack of Coping Capacity
This dimension measures the ability of a country to manage and recover from disasters through its infrastructure and government effort.
Sub-Index: Institutional Capacity
Measures the "soft" infrastructure of a country's disaster management:
Governance: Captures government effectiveness, resilience-building, and political integrity (lack of corruption).
DRR Implementation: Quantifies how well Disaster Risk Reduction activities are actually put into practice.
Sub-Index: Infrastructure
Measures the "hard" assets and systems available during a crisis:
Communication: Evaluates the efficiency of early warning dissemination and the literacy/education of the recipients.
Physical Connectivity: Assesses the accessibility of transport and the quality/availability of water and sanitation services.
Access to Healthcare: Captures health system strength, including physician density and maternal/infant health services.
Percentage of women who are literate. This indicator highlights the importance of electricity for women, who spend the majority of their time taking care of the households. Electricity can ease girls and young women from houdeholds duties and allow them to attend schools. Thus, the lower the number of households with access to electricity the greater the potential for decentralised renewable energies to improve literacy levels among women.
Adult literacy rate is the percentage of people ages 15 and above who can both read and write with understanding a short simple statement about their everyday life. Literacy statistics for most countries cover the population ages 15 and older, but some include younger ages or are confined to age ranges that tend to inflate literacy rates. The youth literacy rate for ages 15-24 reflects recent progress in education. It measures the accumulated outcomes of primary education over the previous 10 years or so by indicating the proportion of the population who have passed through the primary education system and acquired basic literacy and numeracy skills.
Shapefile showing the location of powerplants along the East-African rift system, derived from the World Bank Transmission and distribution: Energy Atlas (ARDERNE, C. 2017)
This dataset is part of the LEAP-RE project collection. For more information visit https://www.leap-re.eu/
This dataset shows the African power plants by energy generation type. It includes thermal plants (coal, gas, oil, nuclear, biomass, waste, geothermal) and renewables (hydro, wind, solar). Each power plant is geolocated and entries contain information on plant capacity and generation type.
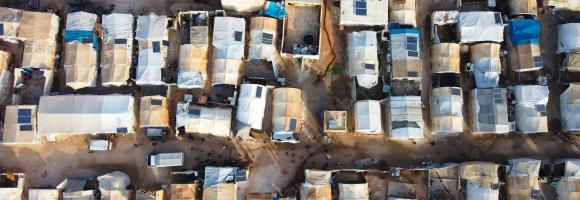
The dataset depicts the total energy demand per settlement (kWh/day) at year 5 under scenario with household consumption raised to 1000 Wh/day (at year 0). This dataset is part of the e Refugee Settlements Electricity Access (RSEA) database, designed and developed to gather the multidimensional factors that can determine a refugee settlement's energy dimension. These factors were chiefly environmental (such as variability of solar radiation and avoided GHG emissions), technical (electrification status, distance to grid), social (population, electricity demand, social infrastructure), and economic (e.g., PV mini-grid component prices) considerations that can influence a stakeholder decision on the deployment of a PV and battery storage mini-grid in a displacement setting.
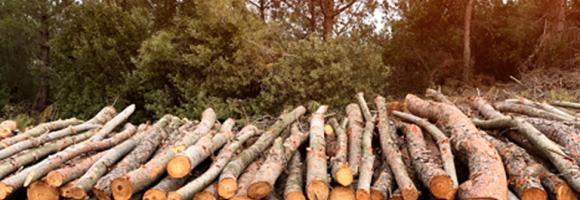
Carbon storage in biomass (biological material) is a key link in the global carbon cycle, and consequently for climate change mitigation. Forests in particular are an important carbon sink that help reduce the greenhouse effect. Together, the above-ground carbon (carbon fraction contained in the stems, barks, branches and twigs of living trees), the belowground biomass carbon (carbon fraction contained in roots of living trees) and the soil organic carbon (amount of carbon stored in the soil) provide a complete overview of the total carbon stored in forest areas (trees and soil). This map shows the total carbon stored expressed in units of dry mass (Mg) per ground area unit (km2).
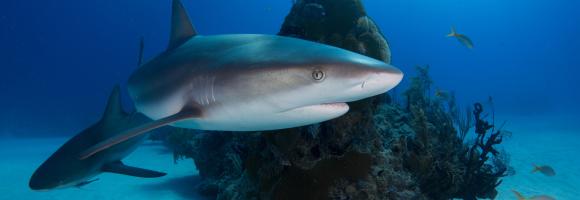
The global capture fisheries has increased over the last 50 years as the consumption of seafood has doubled.This has increased pressure on fish stocks across the world. According to the State of World Fishery and Aquaculture 2020(FAO), the global capture fisheries production rose 14% from 1990 to 2018 and in 2018 it reached 96.4million tonnes. Here we show how much wild fish African countries caught in their EEZ in the last ten years (tonnes). In the attribute table you can find how much of the threatened marine fish species had be legally caught
Percentage of undernourished people. The higher the incidence of undernourished people the more beneficial decentralised renewable energy solutions may be, in terms of improving both cooking facilities within households and agricultural productivity with positive impacts on nutrition. Thus electricity can be used to make agricultural practices more efficient and refrigerate food produce to store for longer.
Prevalence of underweight (weight-for-age <-2 standard deviation from the median of the World Health Organization (WHO) Child Growth Standards) among children under 5 years of age. Survey estimates are based on standardized methodology using the WHO Child Growth Standards. Global and regional estimates are based on methodology outlined in UNICEF-WHO-The World Bank: Joint child malnutrition estimates - Levels and trends (UNICEF/WHO/WB 2012).
"This map shows, for each grid cell, the Capacity installed [MW] by potential Cooling Absorption System and Refrigeration Absorption System. The maps refer to: