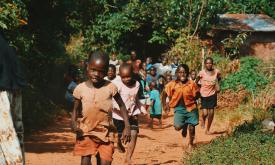
This layer shows the percentage of children under 6 months who are exclusively breastfed, meaning they receive only breast milk without any additional food or drink. Exclusive breastfeeding is a key d...
This layer provides estimates of the percentage of children aged 2 to 10 years (PfPR2–10) with detectable Plasmodium falciparum parasites in 2022. The estimates are generated using geostatistical mode...
This layer represents the estimated travel time (in hours) by foot to the nearest primary school. The accessibility map is generated using a well-established geospatial methodology that integrates roa...
This layer represents the estimated travel time (in hours) by foot to the nearest healthcare facility. The underlying methodology is described in Weiss et al. (2020), which leverages major data collec...
This layer shows the estimated number of deaths per 1,000 live births among children under 5 years of age (in 2017) — a key indicator of child survival and overall health system performance. High unde...
This layer shows the percentage of children under 5 experiencing severe wasting (in 2019) — the most critical form of acute malnutrition. These children face a significantly higher risk of mortality ...
This layer shows the percentage of children under 5 years of age (in 2019) who are underweight, based on low weight-for-age. Underweight is a composite indicator capturing both chronic and acute under...
This layer shows the prevalence of wasting among children under 5 years of age (in 2019), a sign of acute undernutrition indicated by low weight-for-height. Wasting reflects recent and severe weight l...
This layer shows the percentage of people with access to any improved sanitation facility, including both piped systems (such as sewer or septic tanks) and non-piped improved options (like ventilated ...
Access to piped water reflects the availability of improved water sources directly delivered to households. This layer shows the percentage of people with access to piped water in 2017. Low coverage m...
Priority areas are identified using local coefficients estimated through Geographically Weighted Regression (GWR), which measures the spatially varying relationship between access to sanitation and fo...
Priority areas are identified using local coefficients estimated through Geographically Weighted Regression (GWR), which measures the spatially varying relationship between access to electricity and f...
Priority areas are identified using local coefficients estimated through Geographically Weighted Regression (GWR), which measures the spatially varying relationship between access to piped water and f...
This dataset represents a geographic clip to Africa of the
World Database on Protected Areas (WDPA),
which is the authoritative and most complete global dataset on terrestrial and ...
This spatial dataset contains the geographic boundaries and ecological evaluations of 45 Key Landscapes for Conservation and Development (KLCDs) across Sub-Saharan Africa. Building on the K...